| metric_1 | metric_2 | correlation | abs_correlation |
|---|---|---|---|
| flood_share | pland_flood | 1.000 | 1.000 |
| elevation_mean | elevation_min | 1.000 | 1.000 |
| flood_share | flood_lpi | 0.979 | 0.979 |
| pland_flood | flood_lpi | 0.979 | 0.979 |
| mean_dist_green | min_dist_green | 0.924 | 0.924 |
| gyrate | contig | 0.885 | 0.885 |
| area | gyrate | 0.873 | 0.873 |
| green_percent | area | 0.837 | 0.837 |
4 Metric selection and redundancy check
This chapter explains which metrics were calculated and how the final metric set was selected. At first, a larger set of green-space, FWEI derived flood, distance to green, and DEM metrics was produced for both Delft and Xi’an. However, not all of these metrics were used in the later analysis, because some of them described almost the same spatial pattern.
4.1 Collected metrics
The analysis used three main groups of metrics: green space, FWEI flood indicators, and DEM variables. The green space metrics describe how much green is present and how it is arranged. The flood metrics describe where surface water increase was detected and what pattern it forms. The DEM metrics describe elevation and slope, because lower or flatter areas can be more likely to hold water.
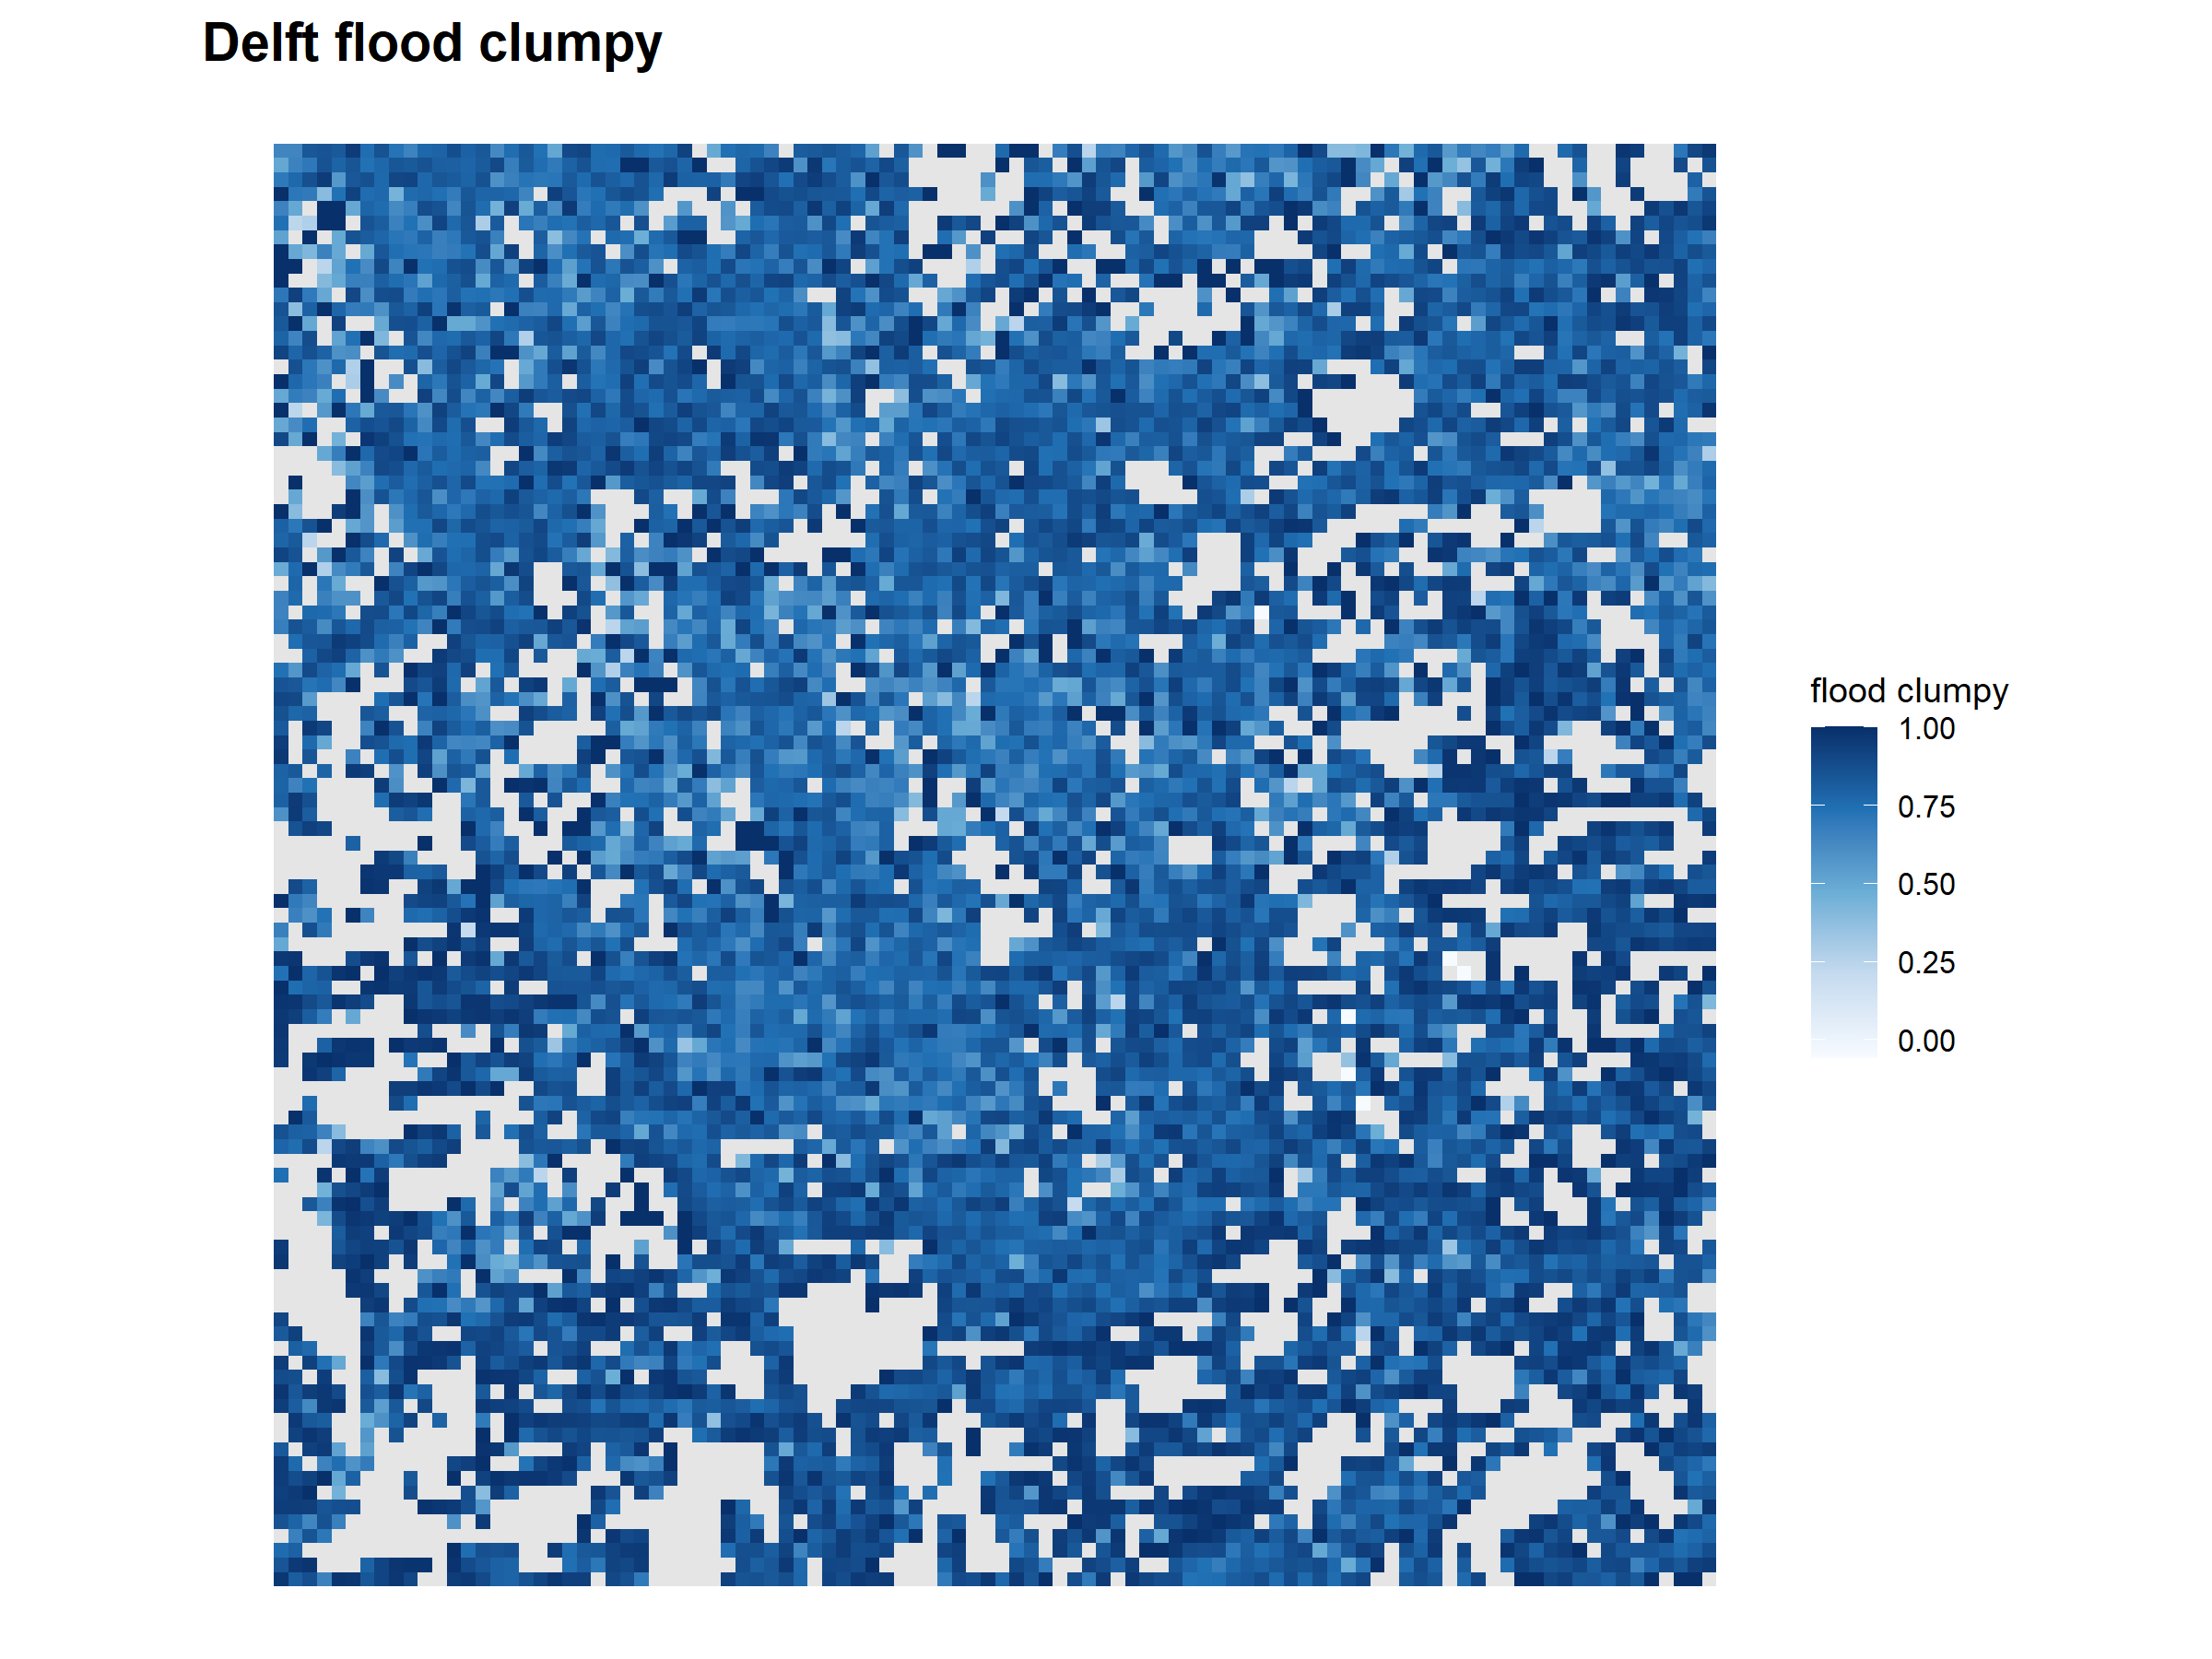
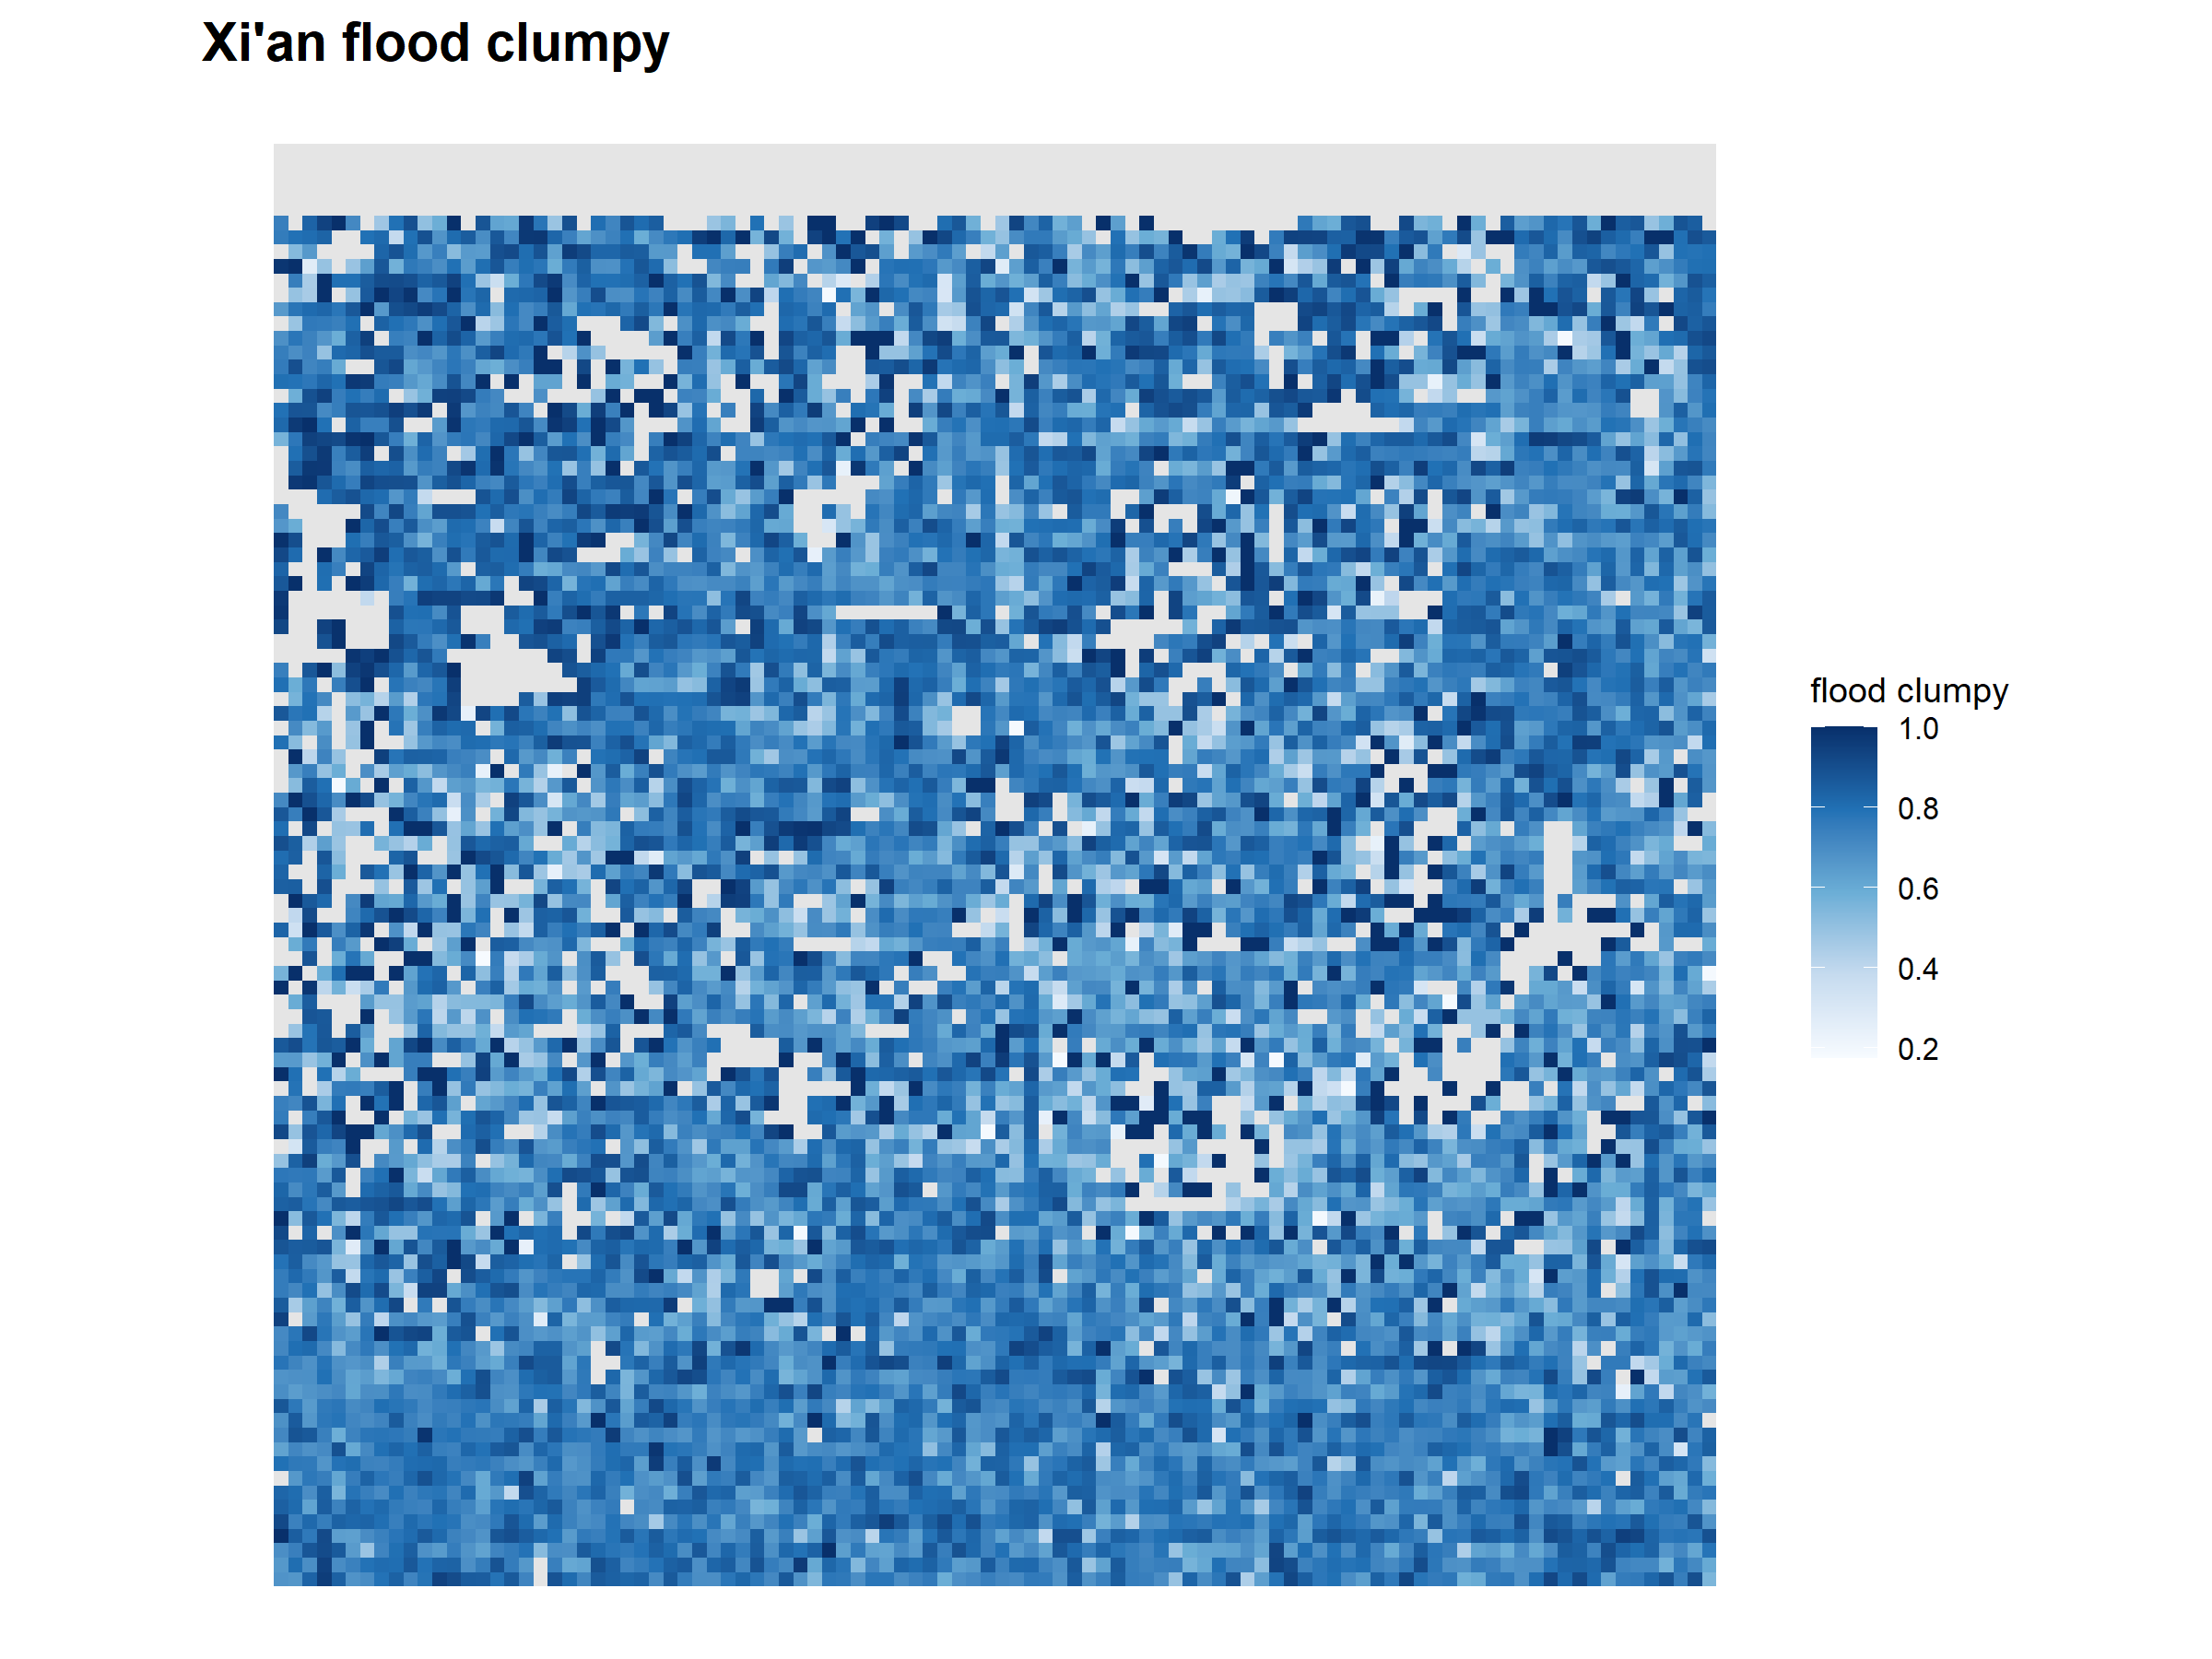
The flood metrics in this chapter were derived from the binary flood change mask, the clipped FWEI change raster thresholded at 0.05 in R. Each metric describes the amount or spatial structure of newly detected surface water per 100 m grid cell, tracing back to the FWEI based satellite detection described in the FWEI chapter.
| Metric group | Metric | Meaning |
|---|---|---|
| Green-space metrics | green_percent |
Percentage of each grid cell covered by green space. |
| Green-space metrics | area |
Average size of green patches. |
| Green-space metrics | gyrate |
Spatial spread of green patches. |
| Green-space metrics | contig |
Compactness and internal connectedness of green patches. |
| Green-space metrics | enn |
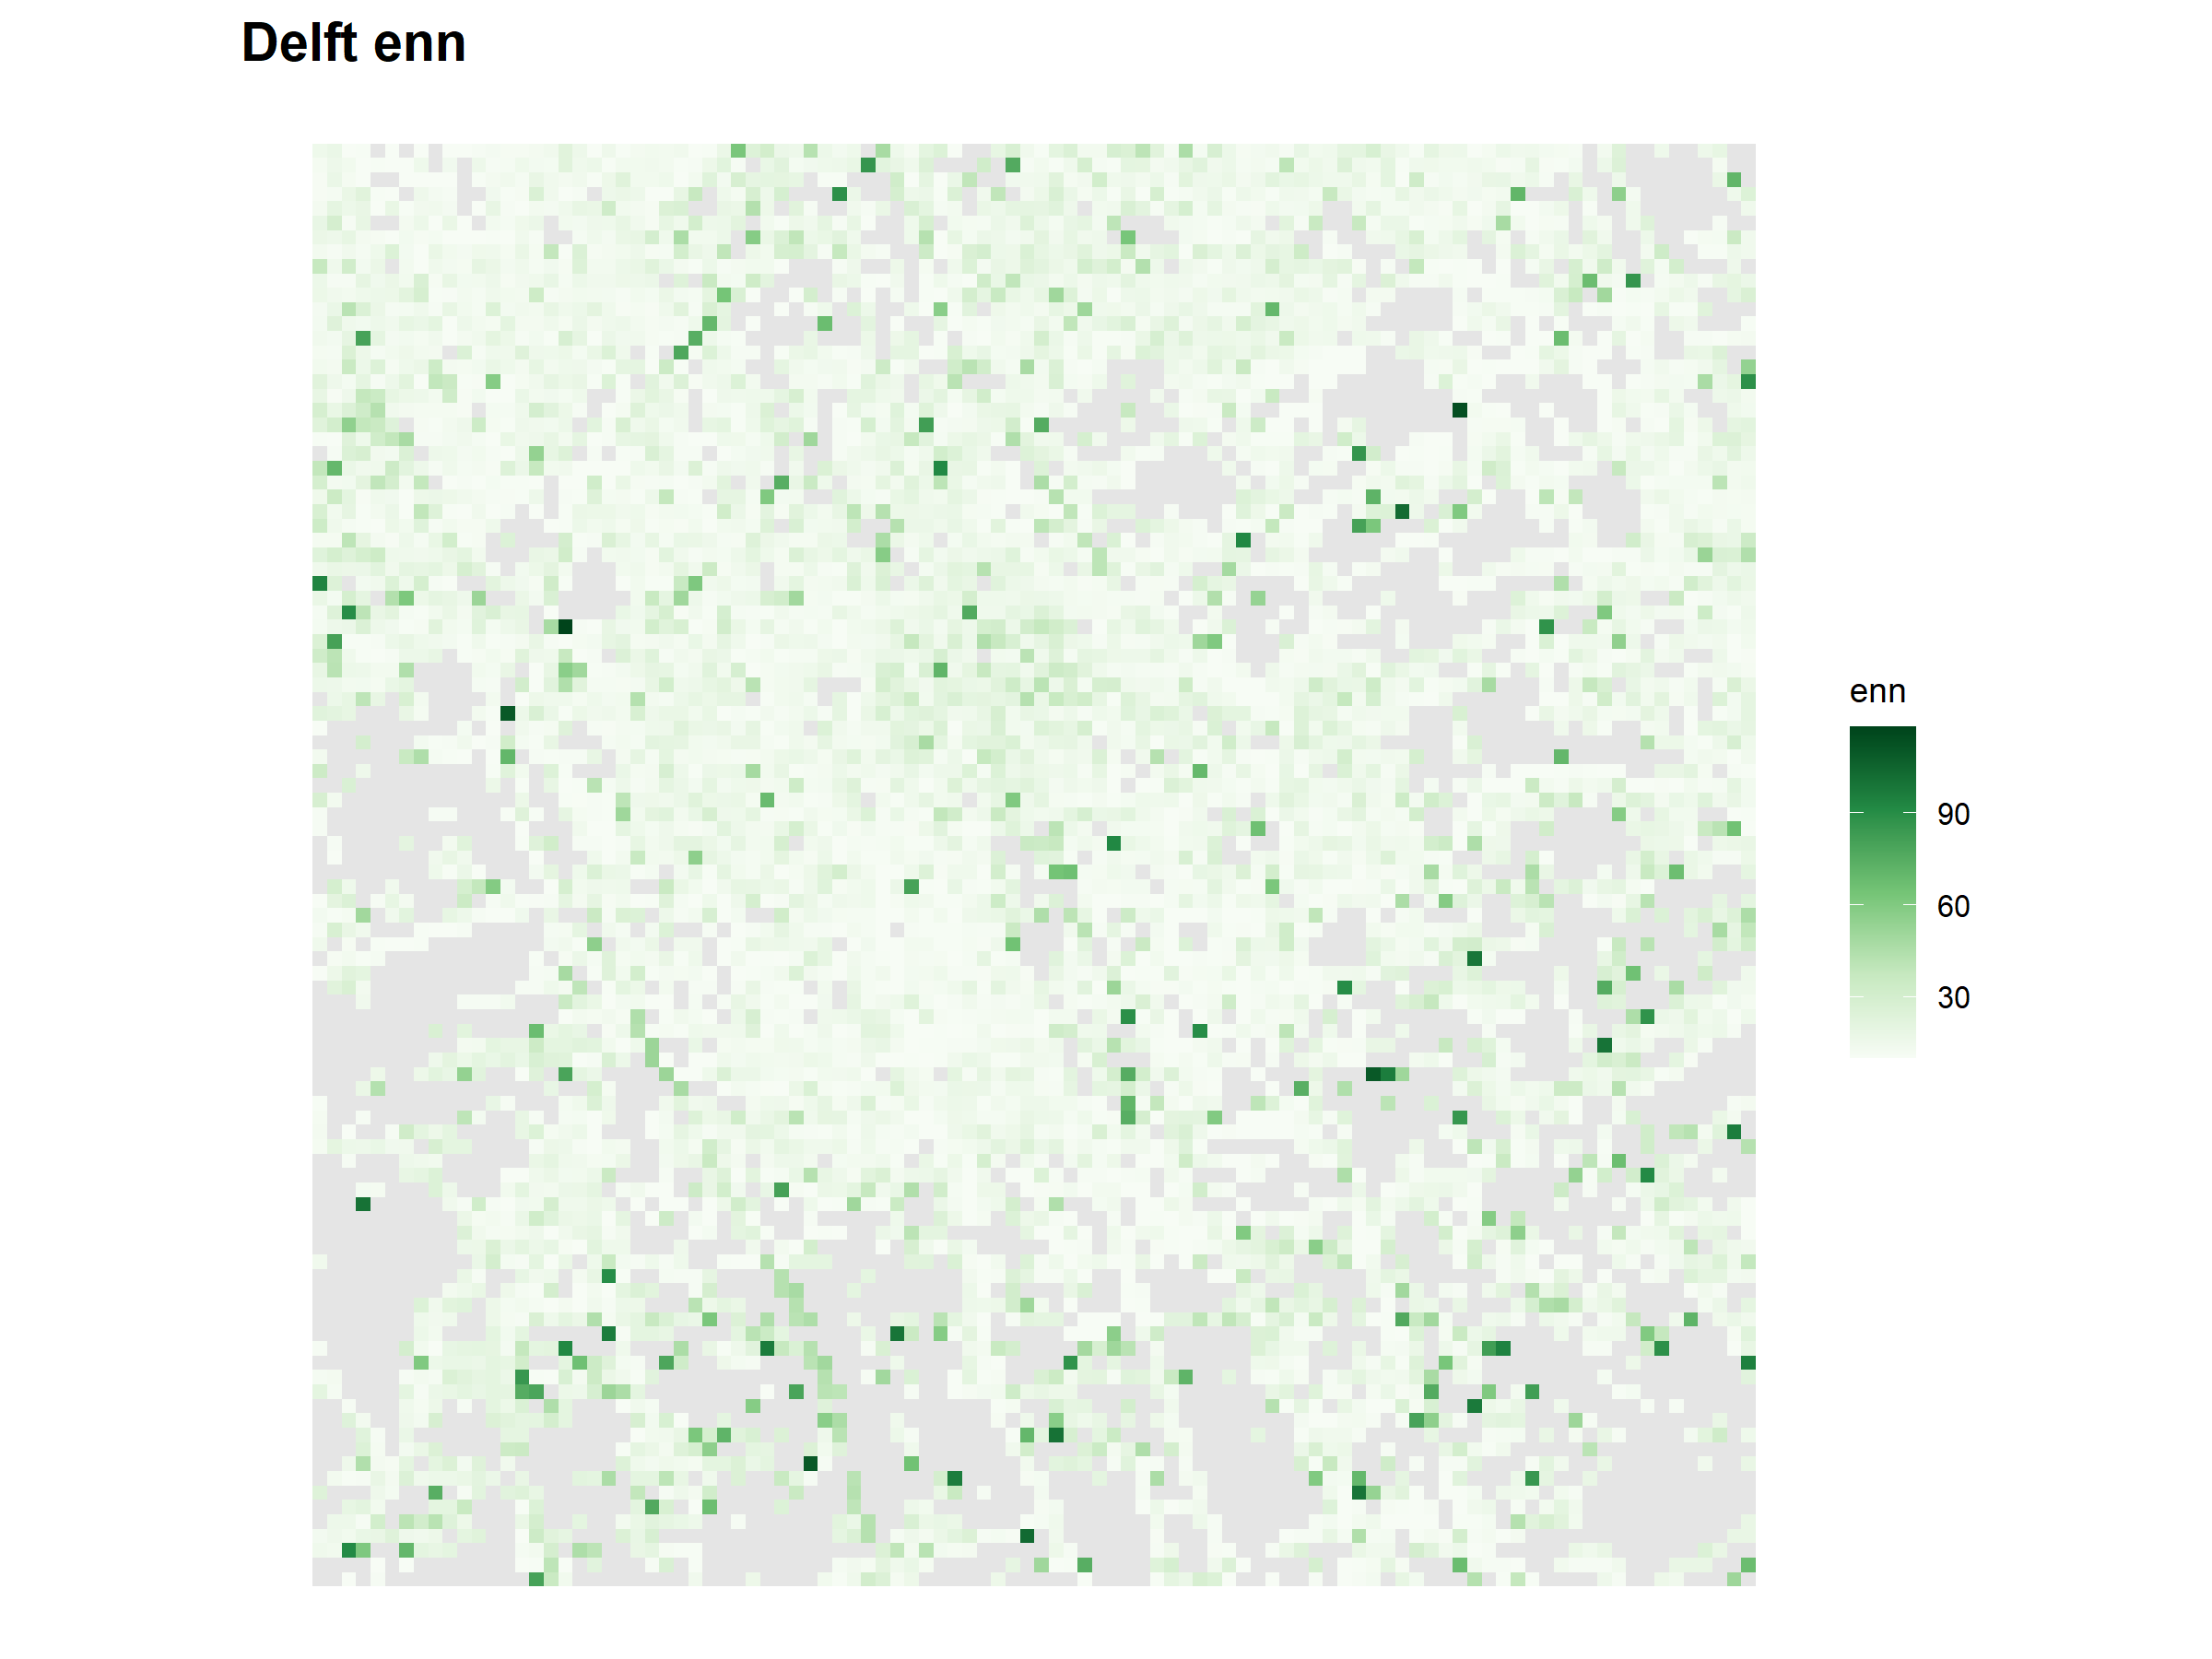
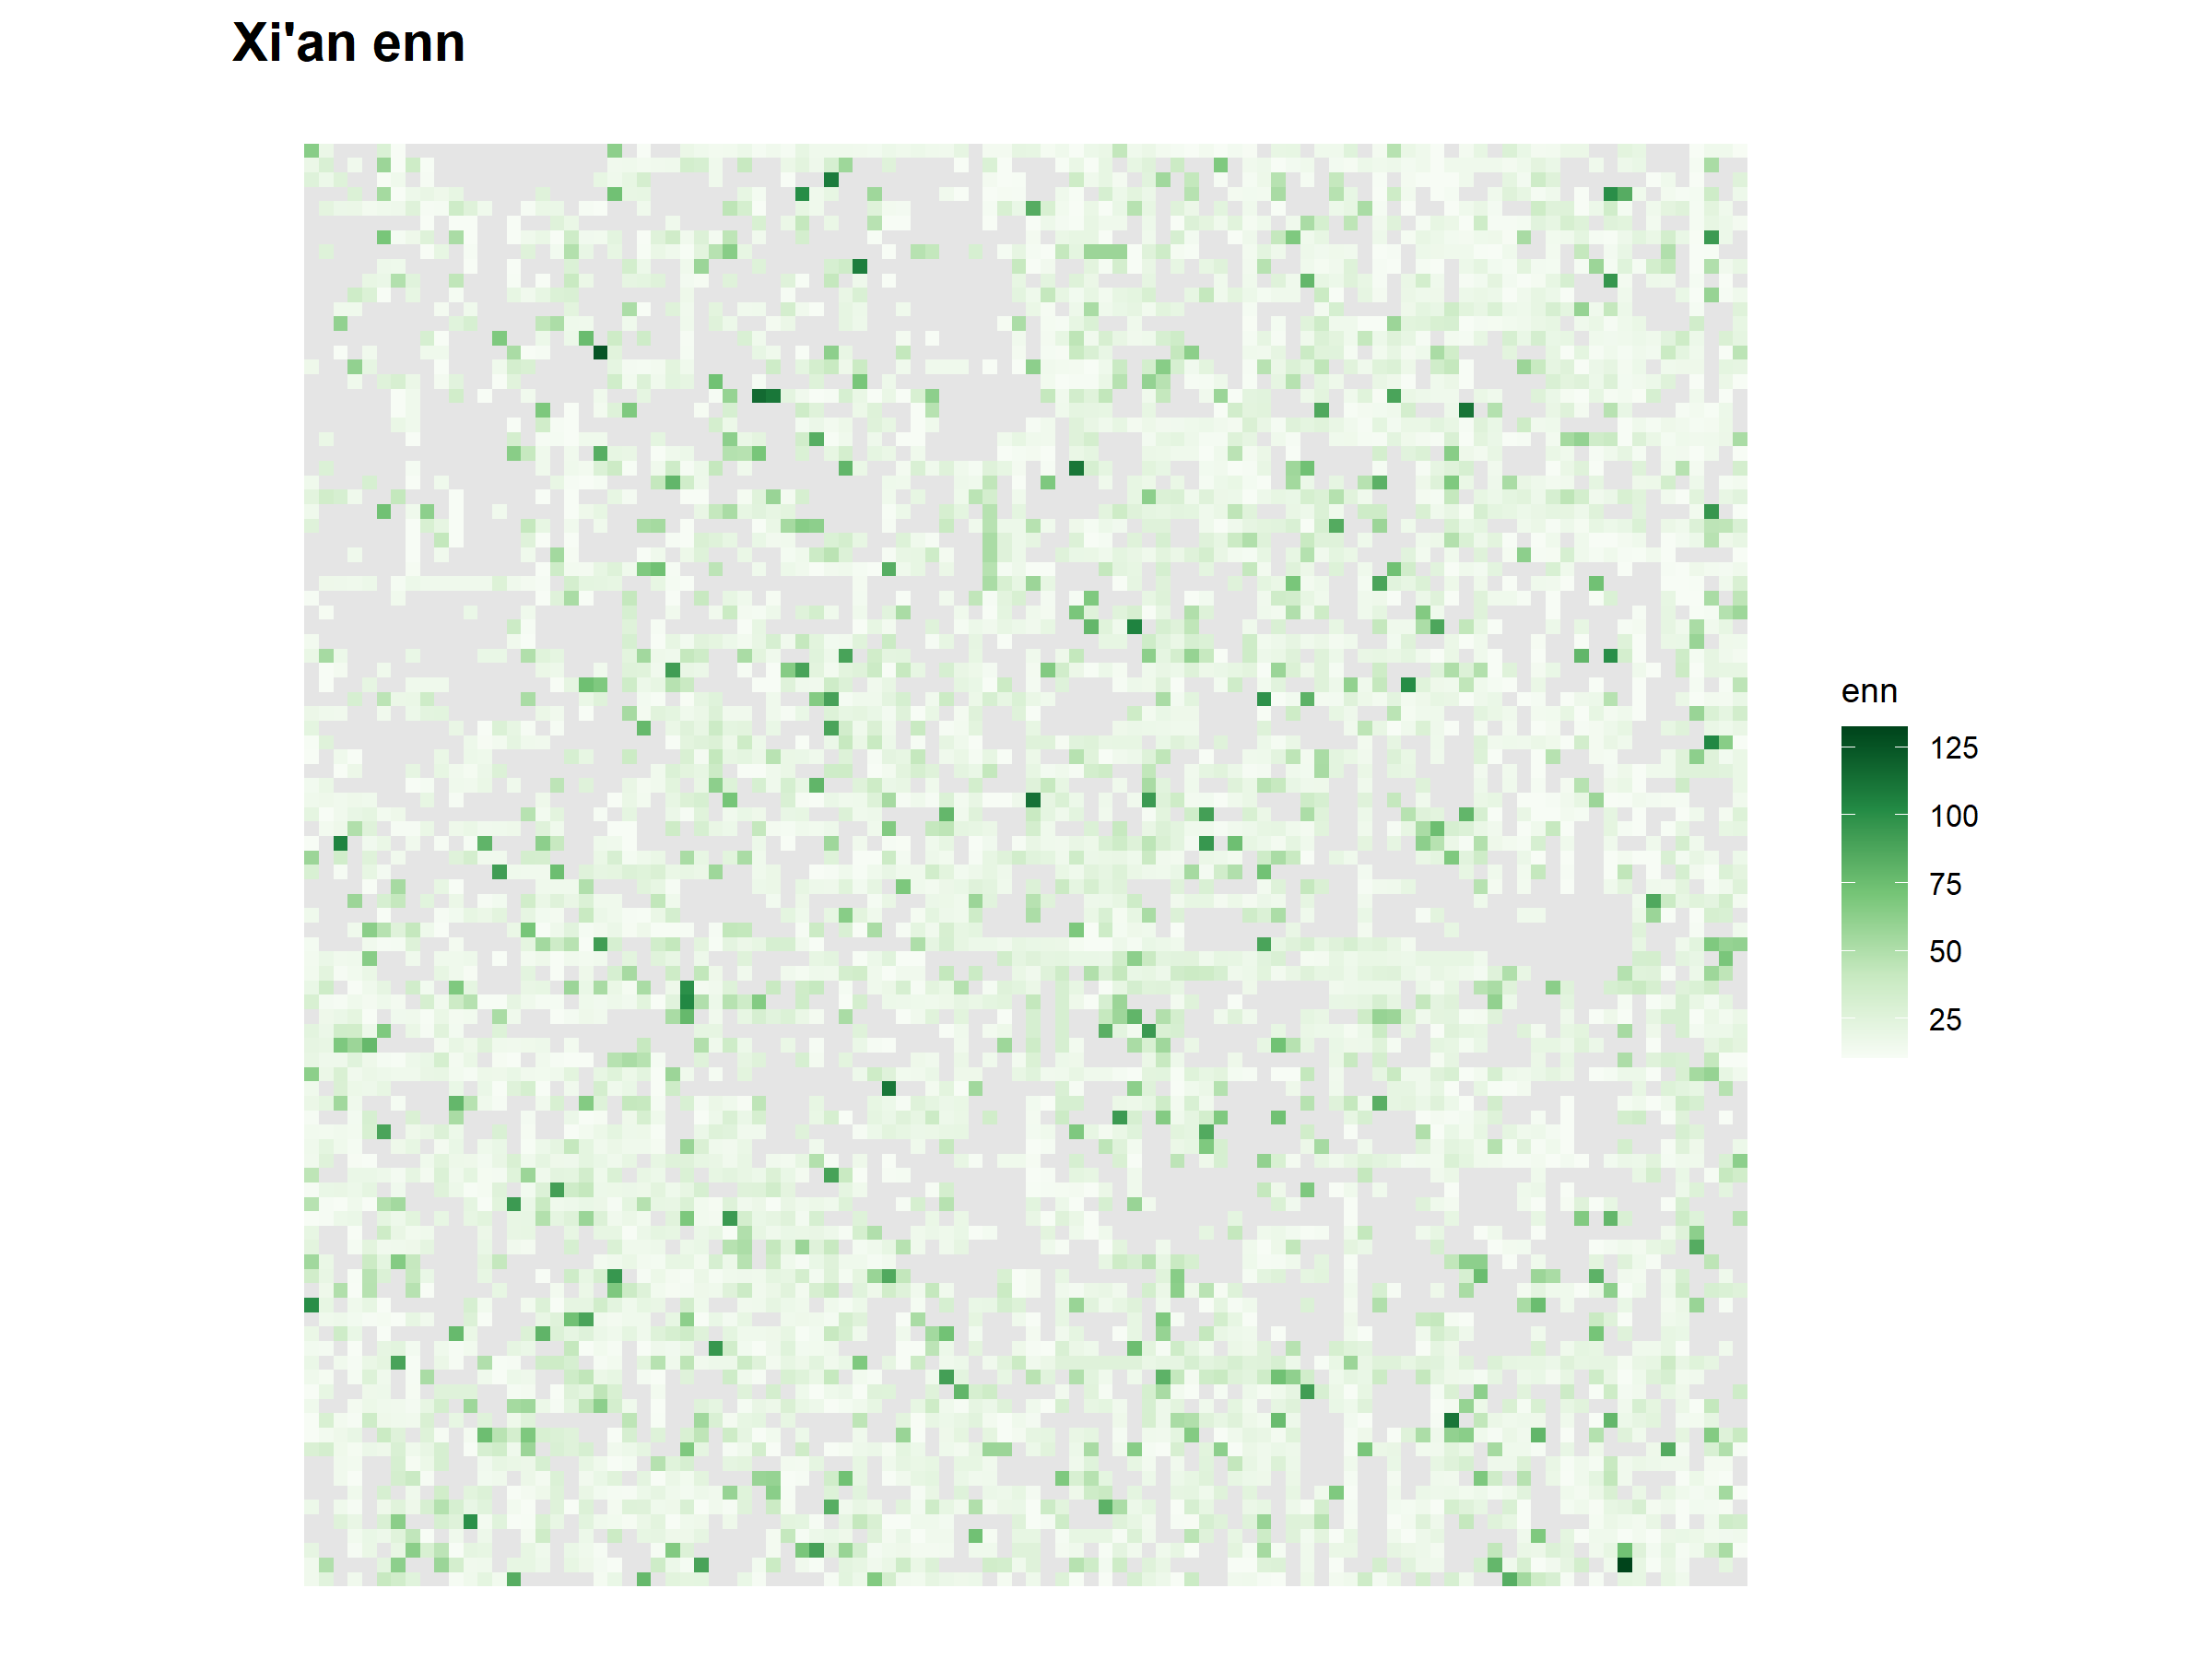
Distance to the nearest neighbouring green patch. |
| Flood metrics | fwei_change_mean |
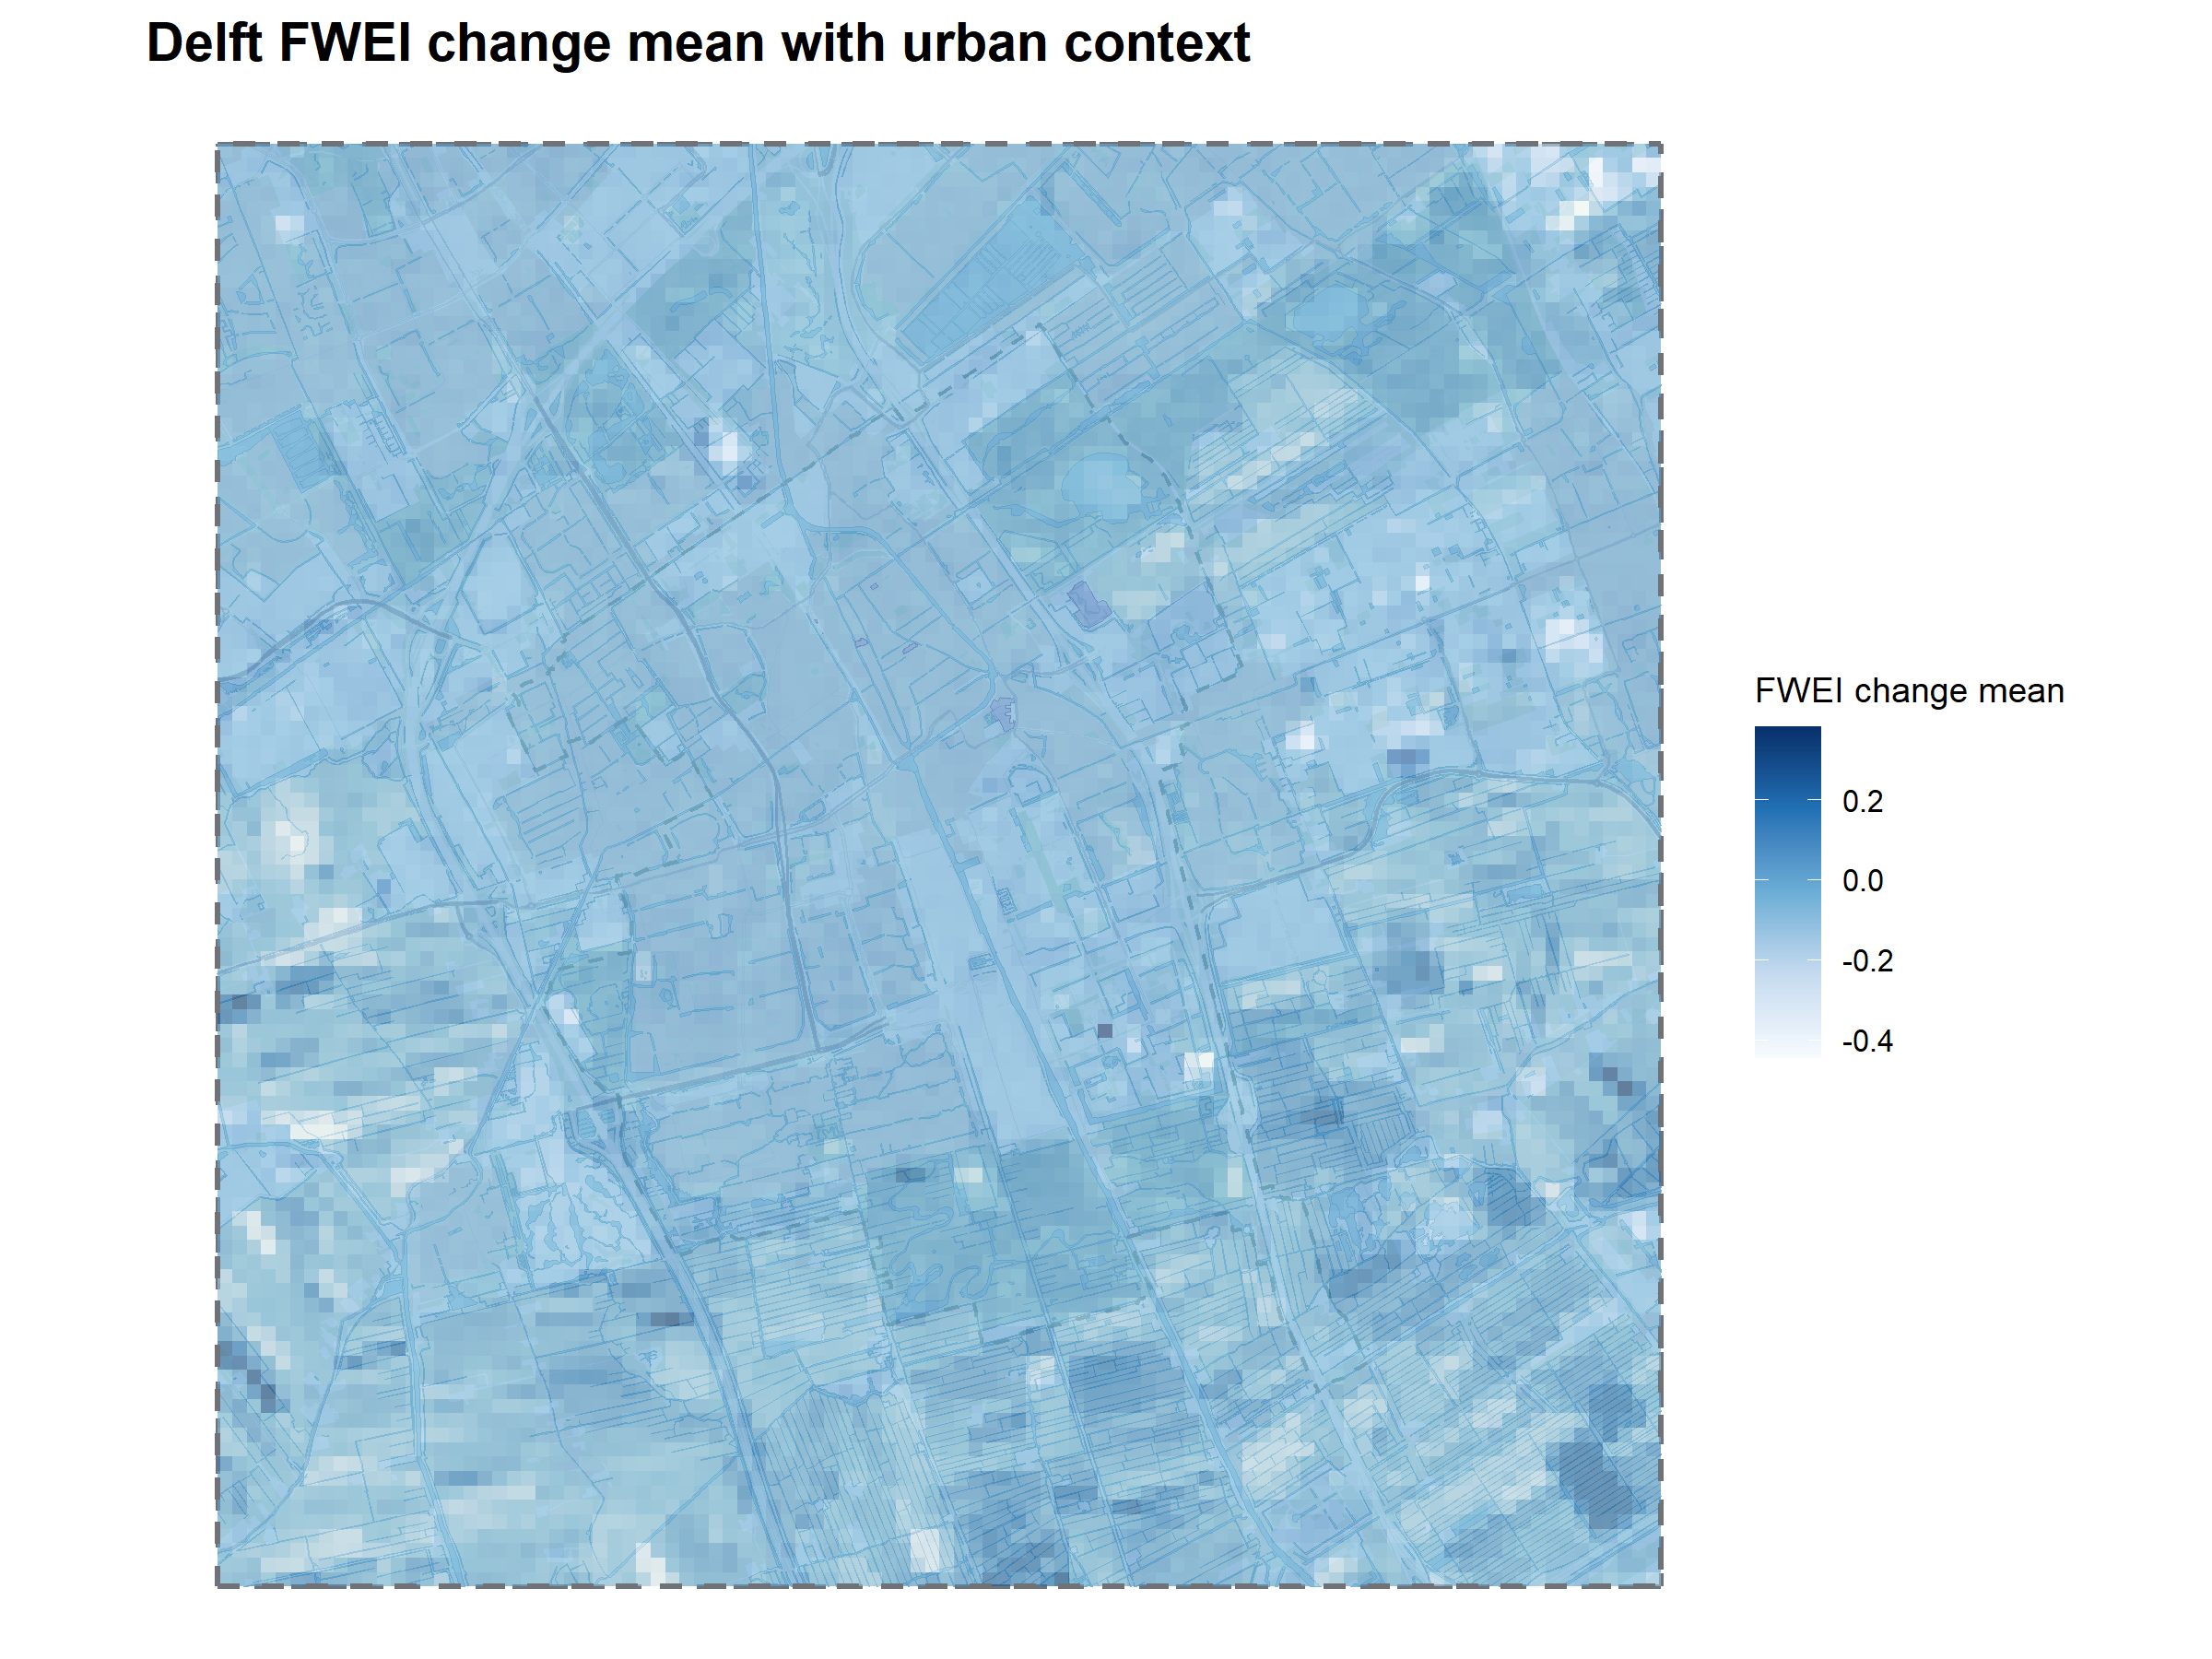
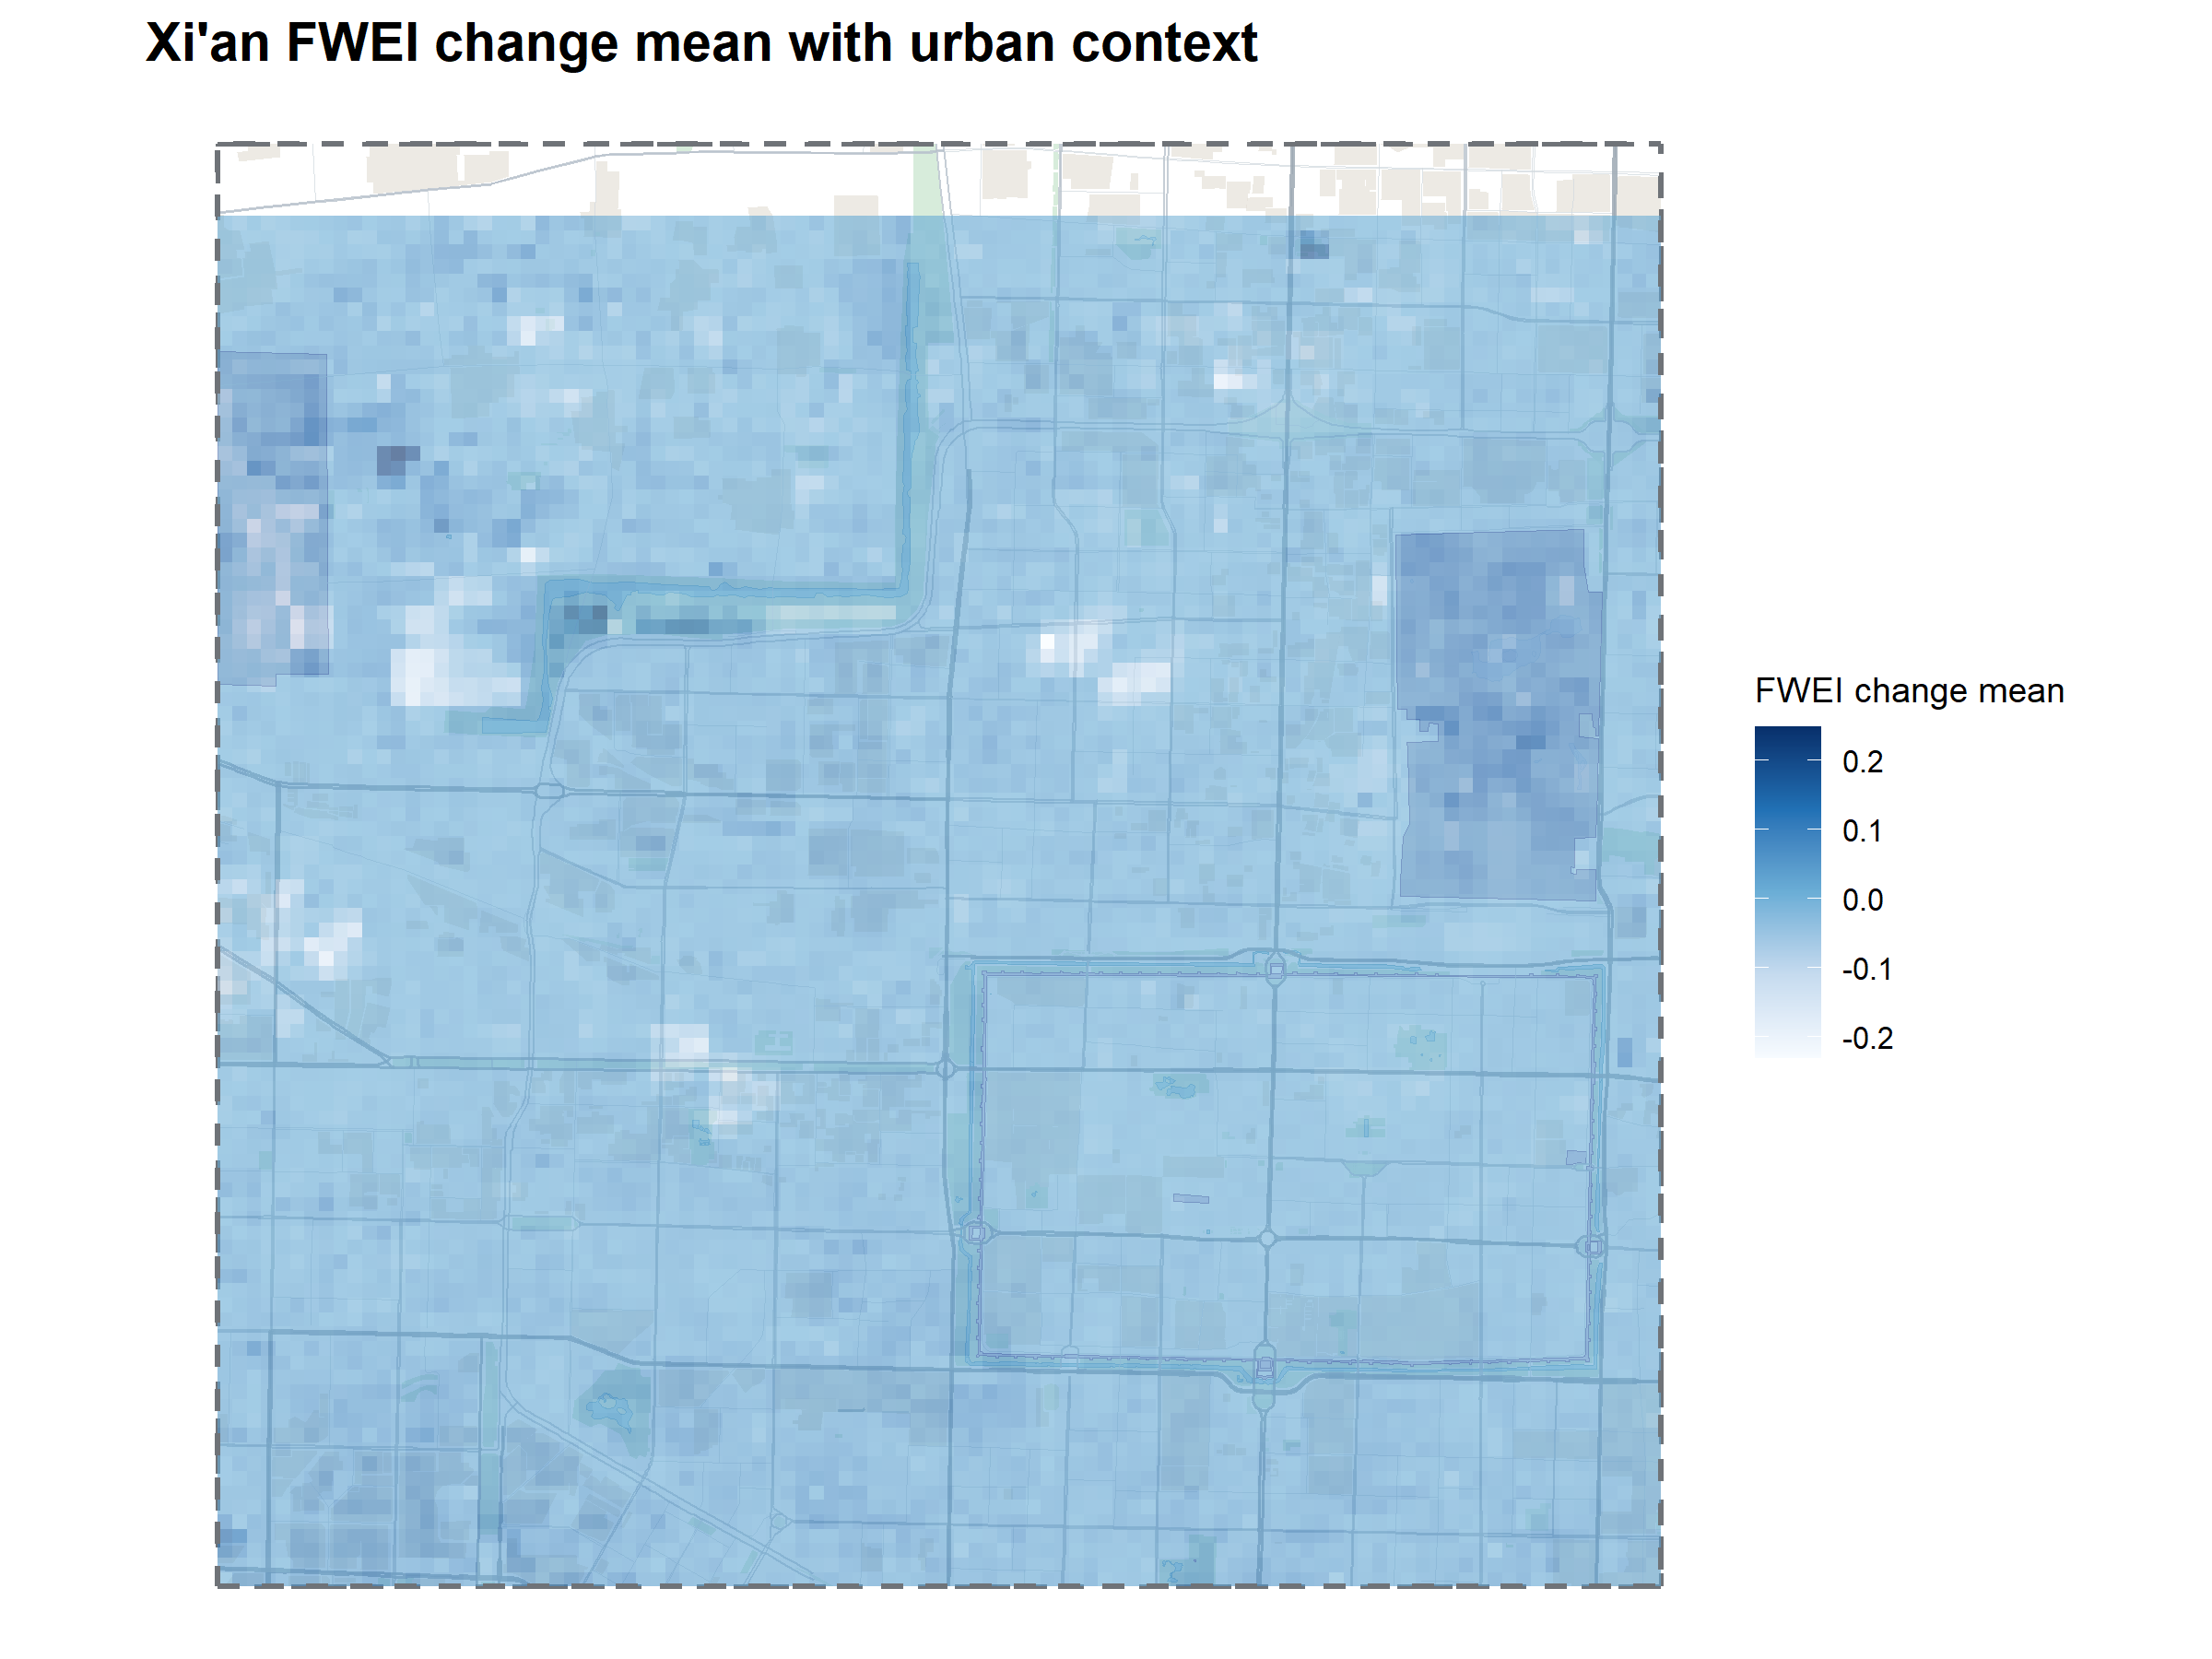
Average FWEI after-minus-before change per grid cell. |
| Flood metrics | flood_share |
Share of each grid cell with detected surface-water increase. |
| Flood metrics | pland_flood |
Percentage of each grid cell covered by detected flood pixels. |
| Flood metrics | np_flood |
Number of separate detected flood patches. |
| Flood metrics | flood_cohesion |
Connectedness of detected flood patches. |
| Flood metrics | flood_clumpy |
Clustering of detected flood pixels. |
| Flood metrics | flood_lpi |
Dominance of the largest detected flood patch. |
| Distance-to-green metrics | mean_dist_green |
Average distance from detected water pixels to the nearest green pixel. |
| Distance-to-green metrics | min_dist_green |
Minimum distance from detected water pixels to the nearest green pixel. |
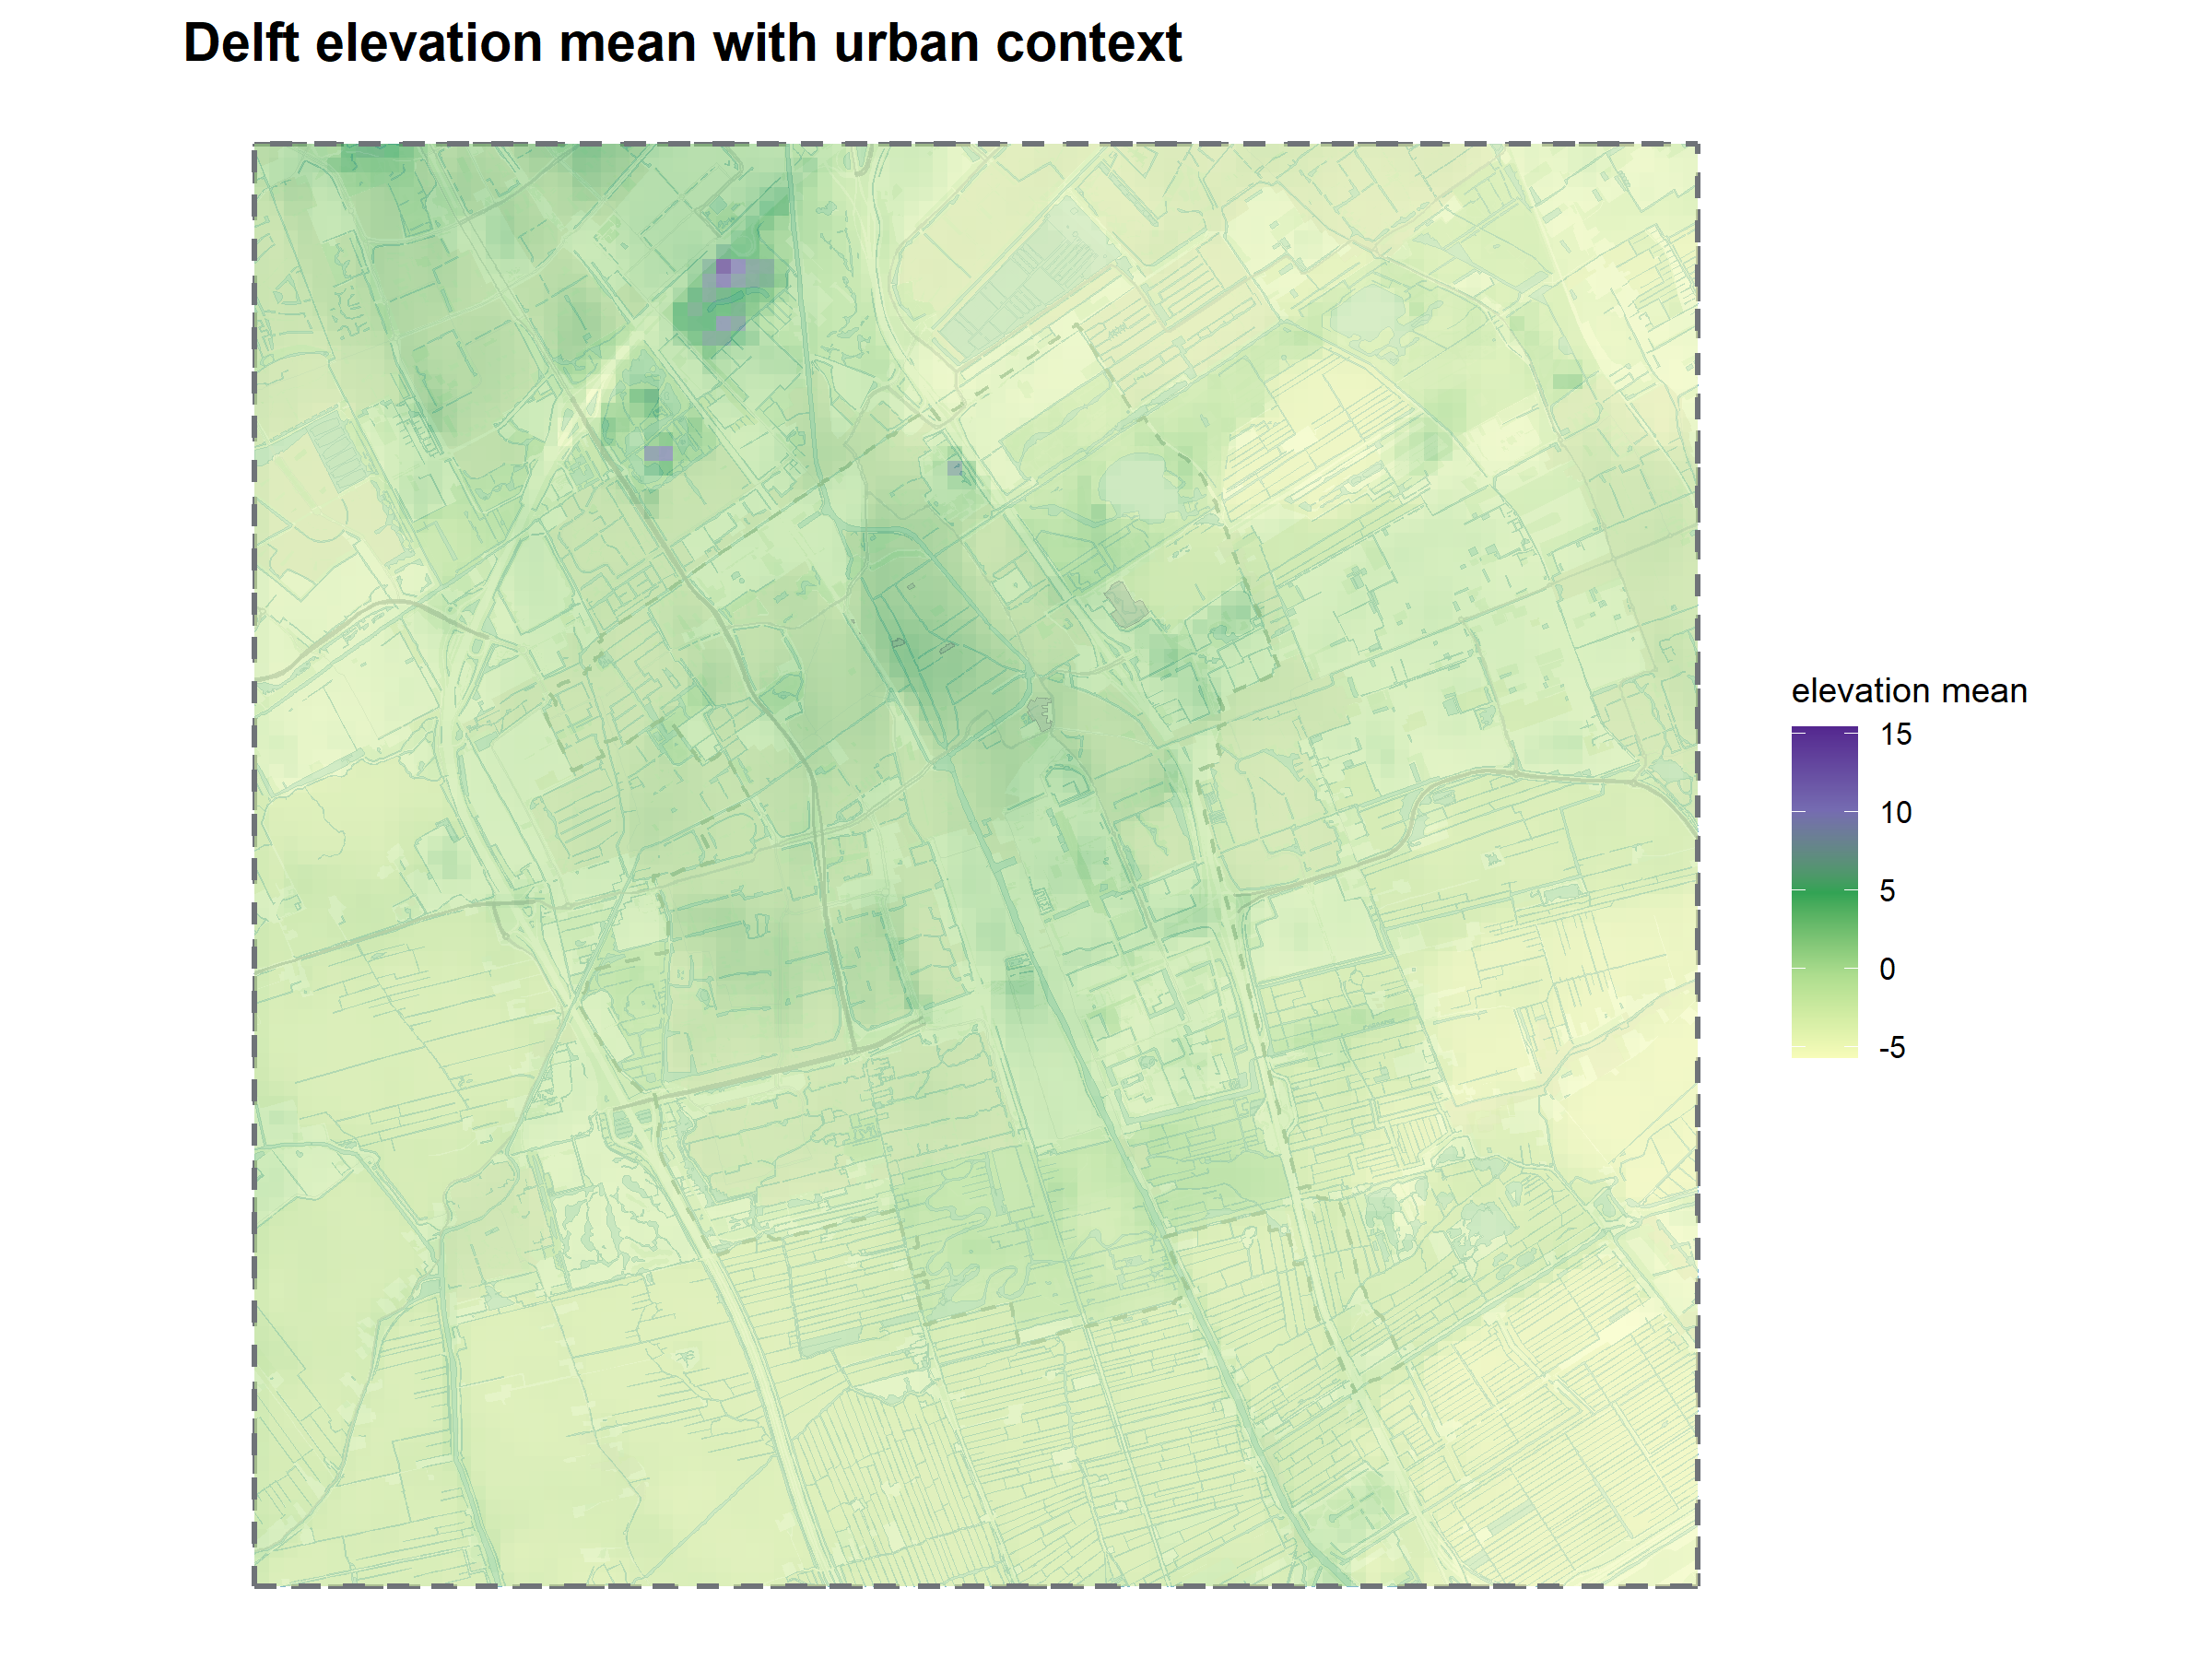
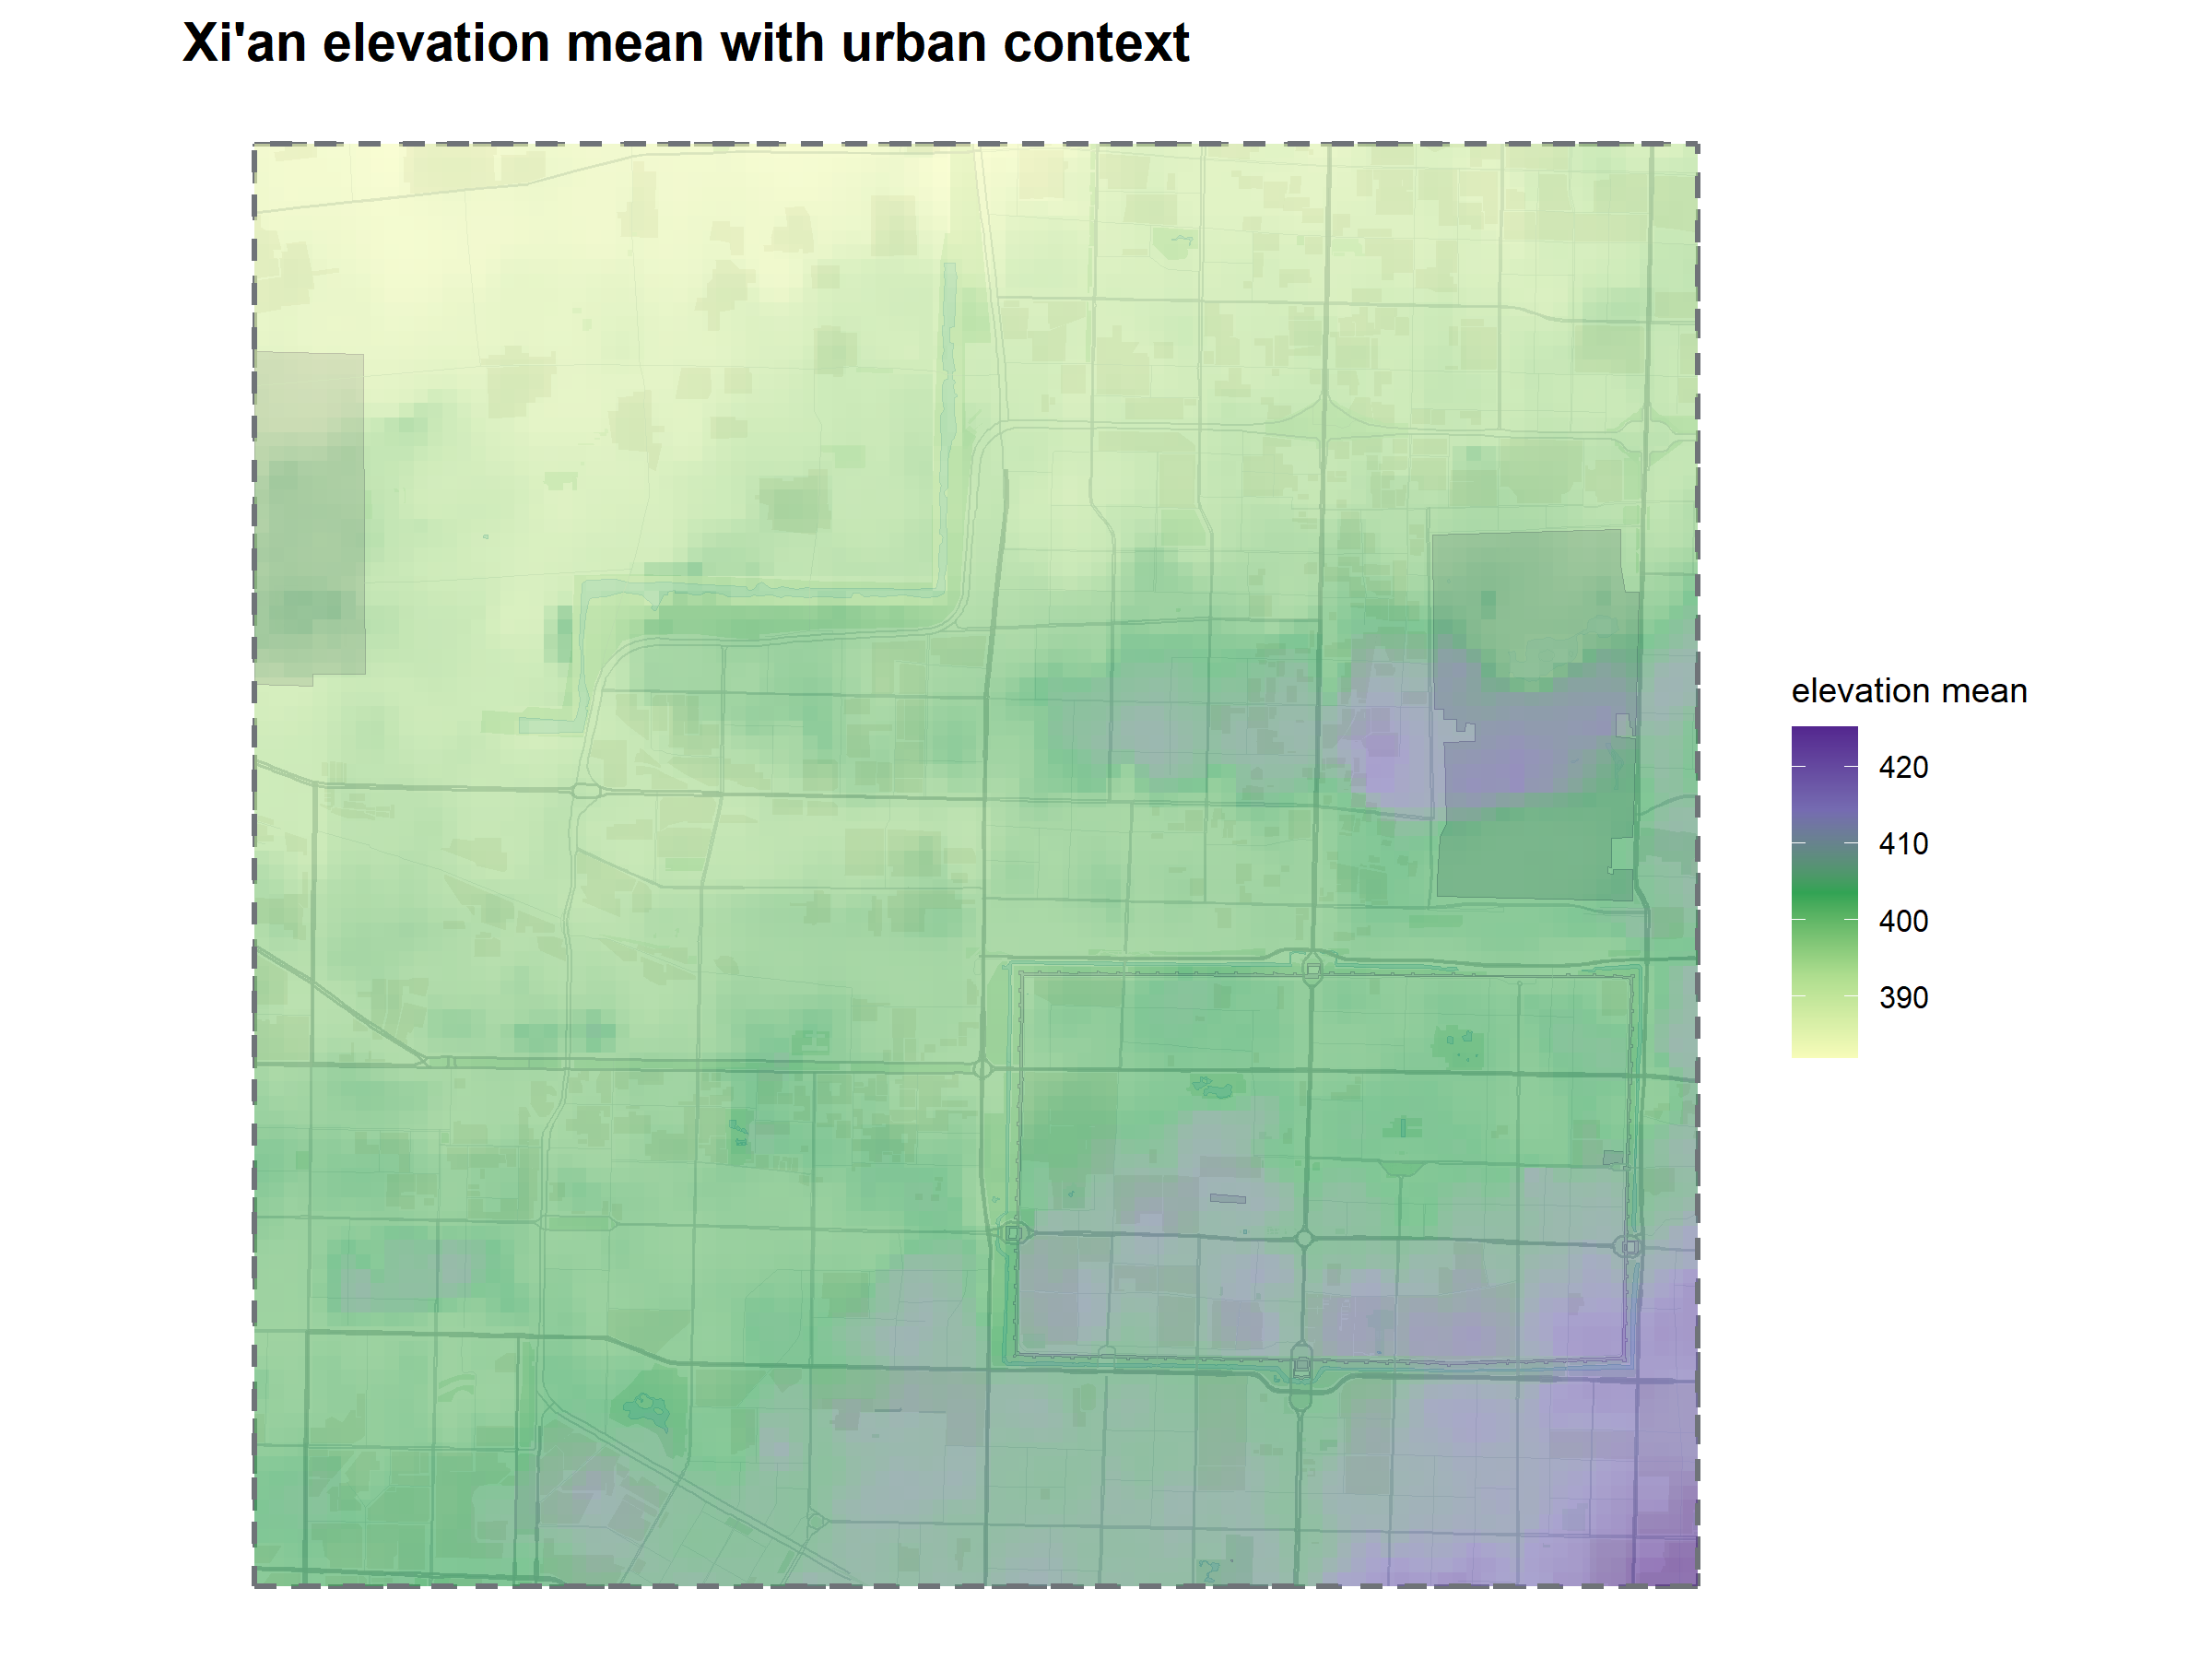
| DEM metrics | elevation_mean |
Average elevation per grid cell. |
| DEM metrics | elevation_min |
Lowest elevation value per grid cell. |
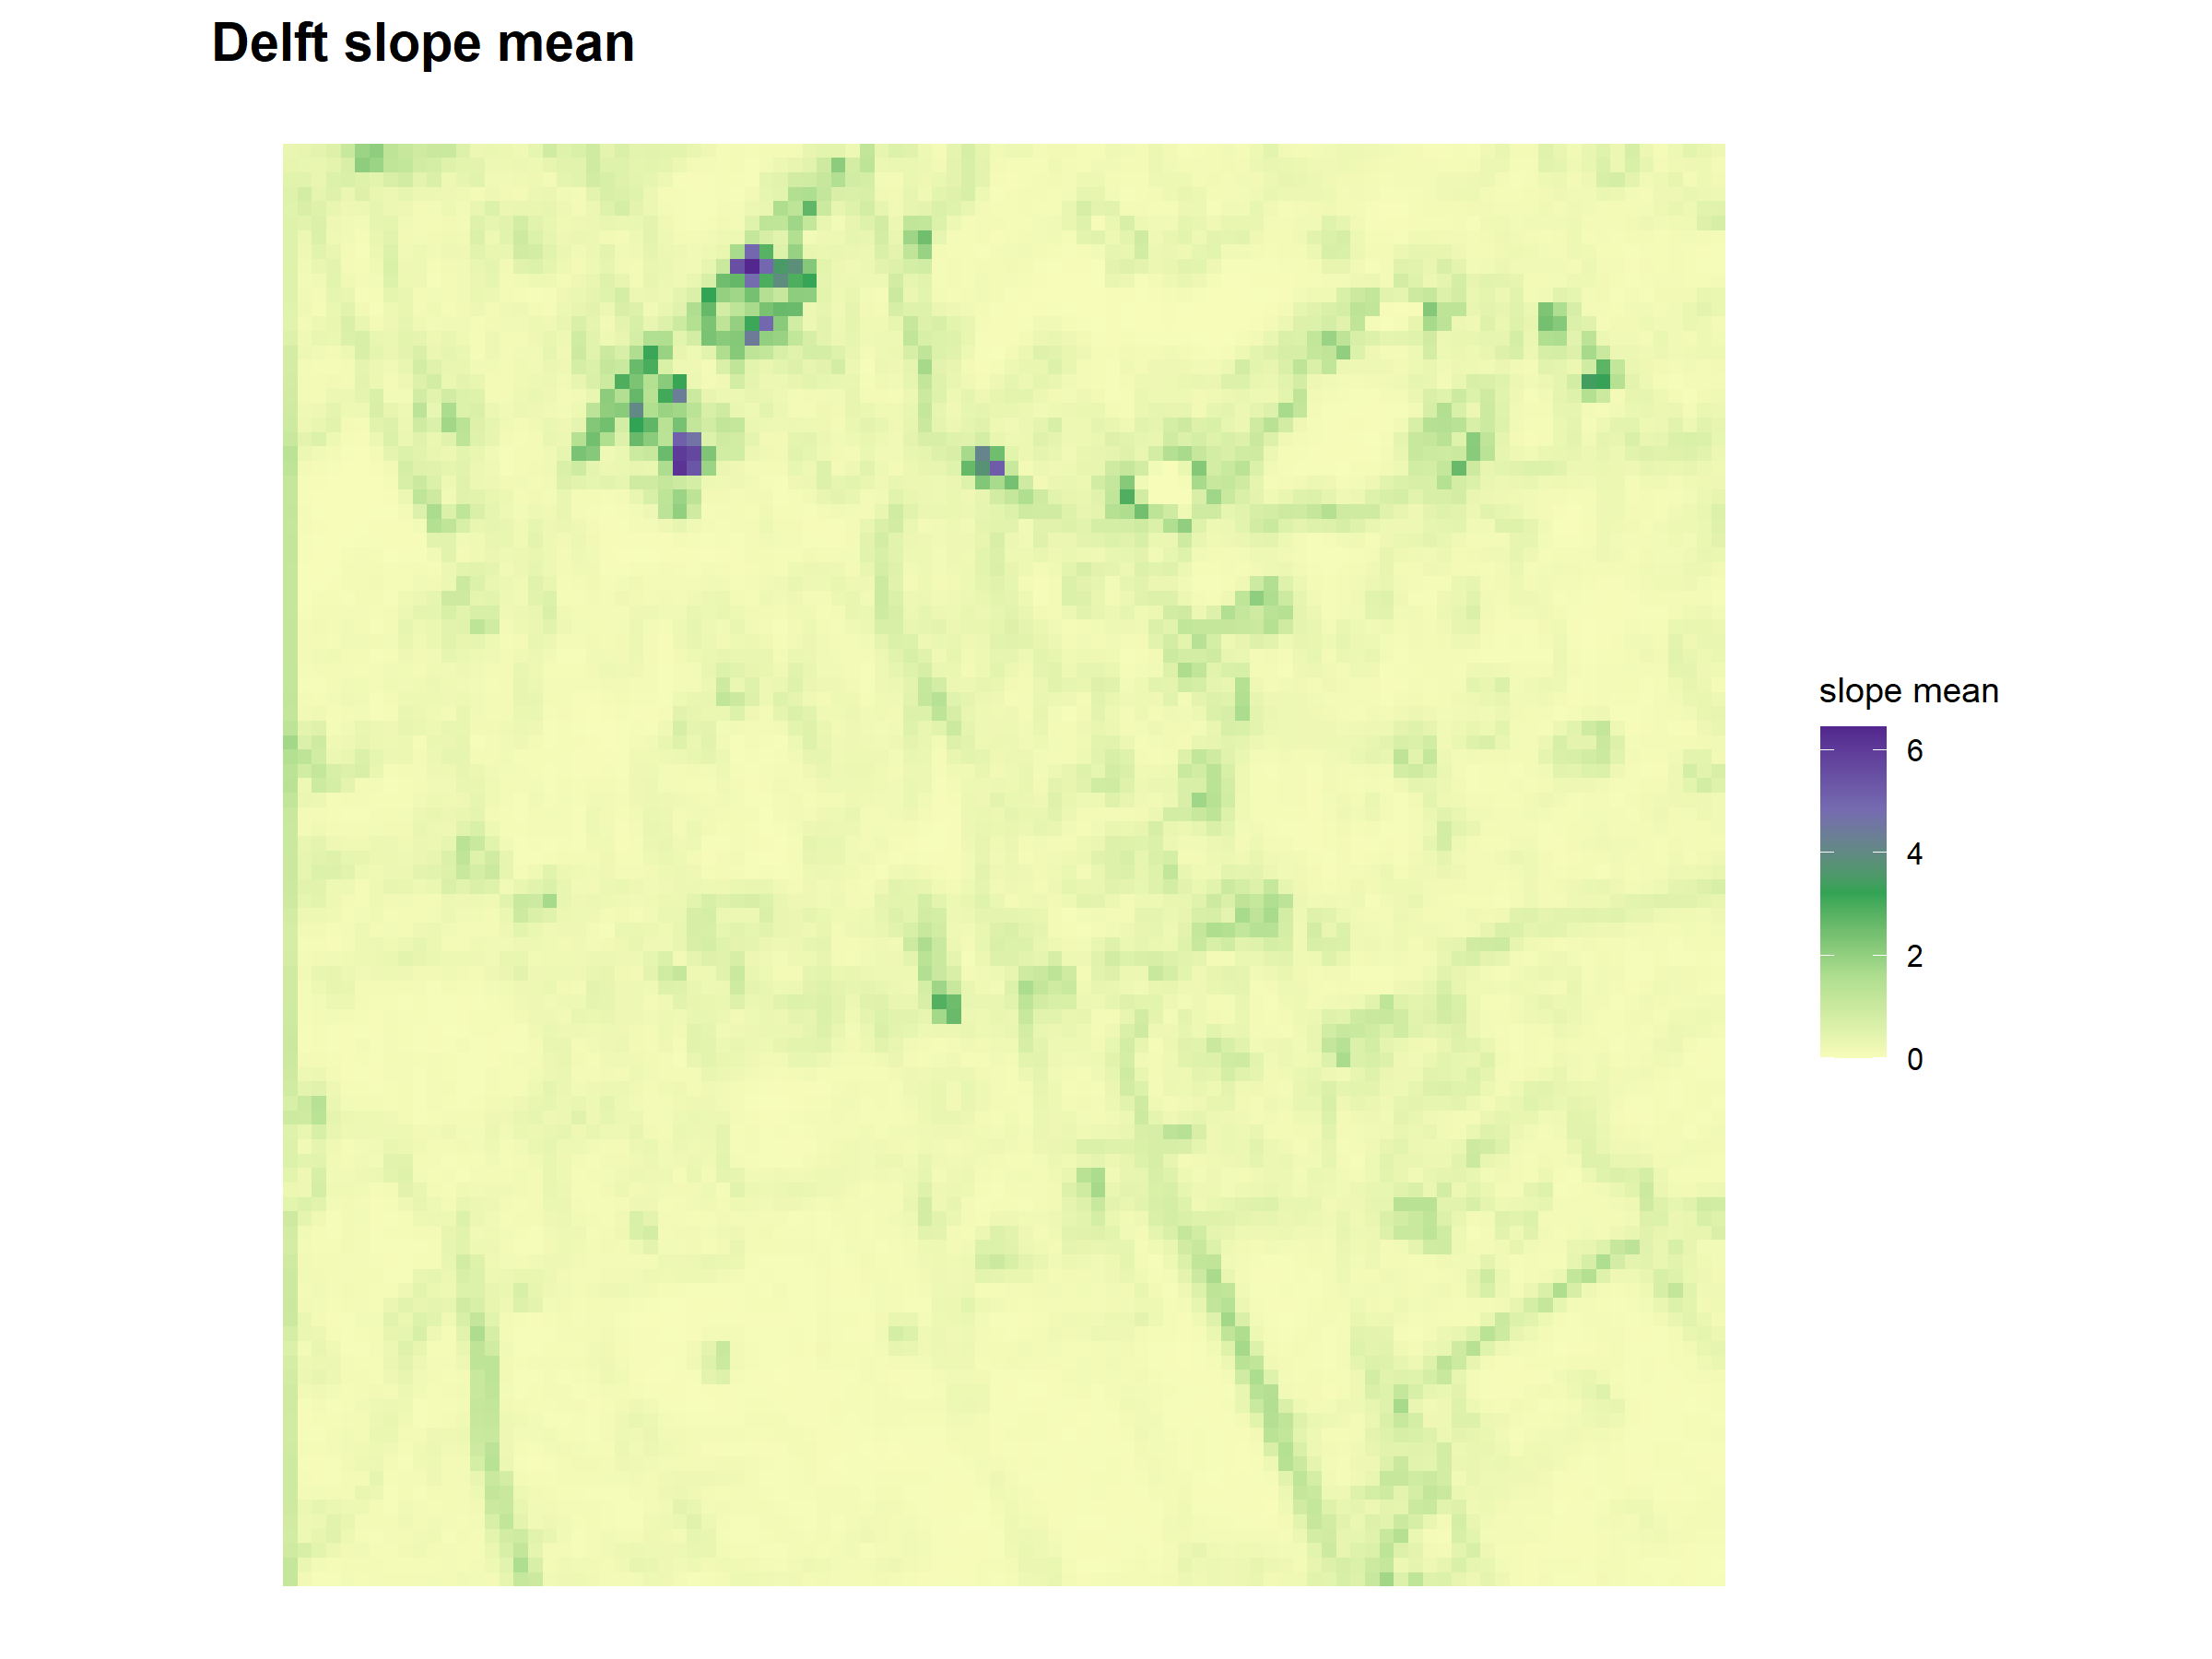
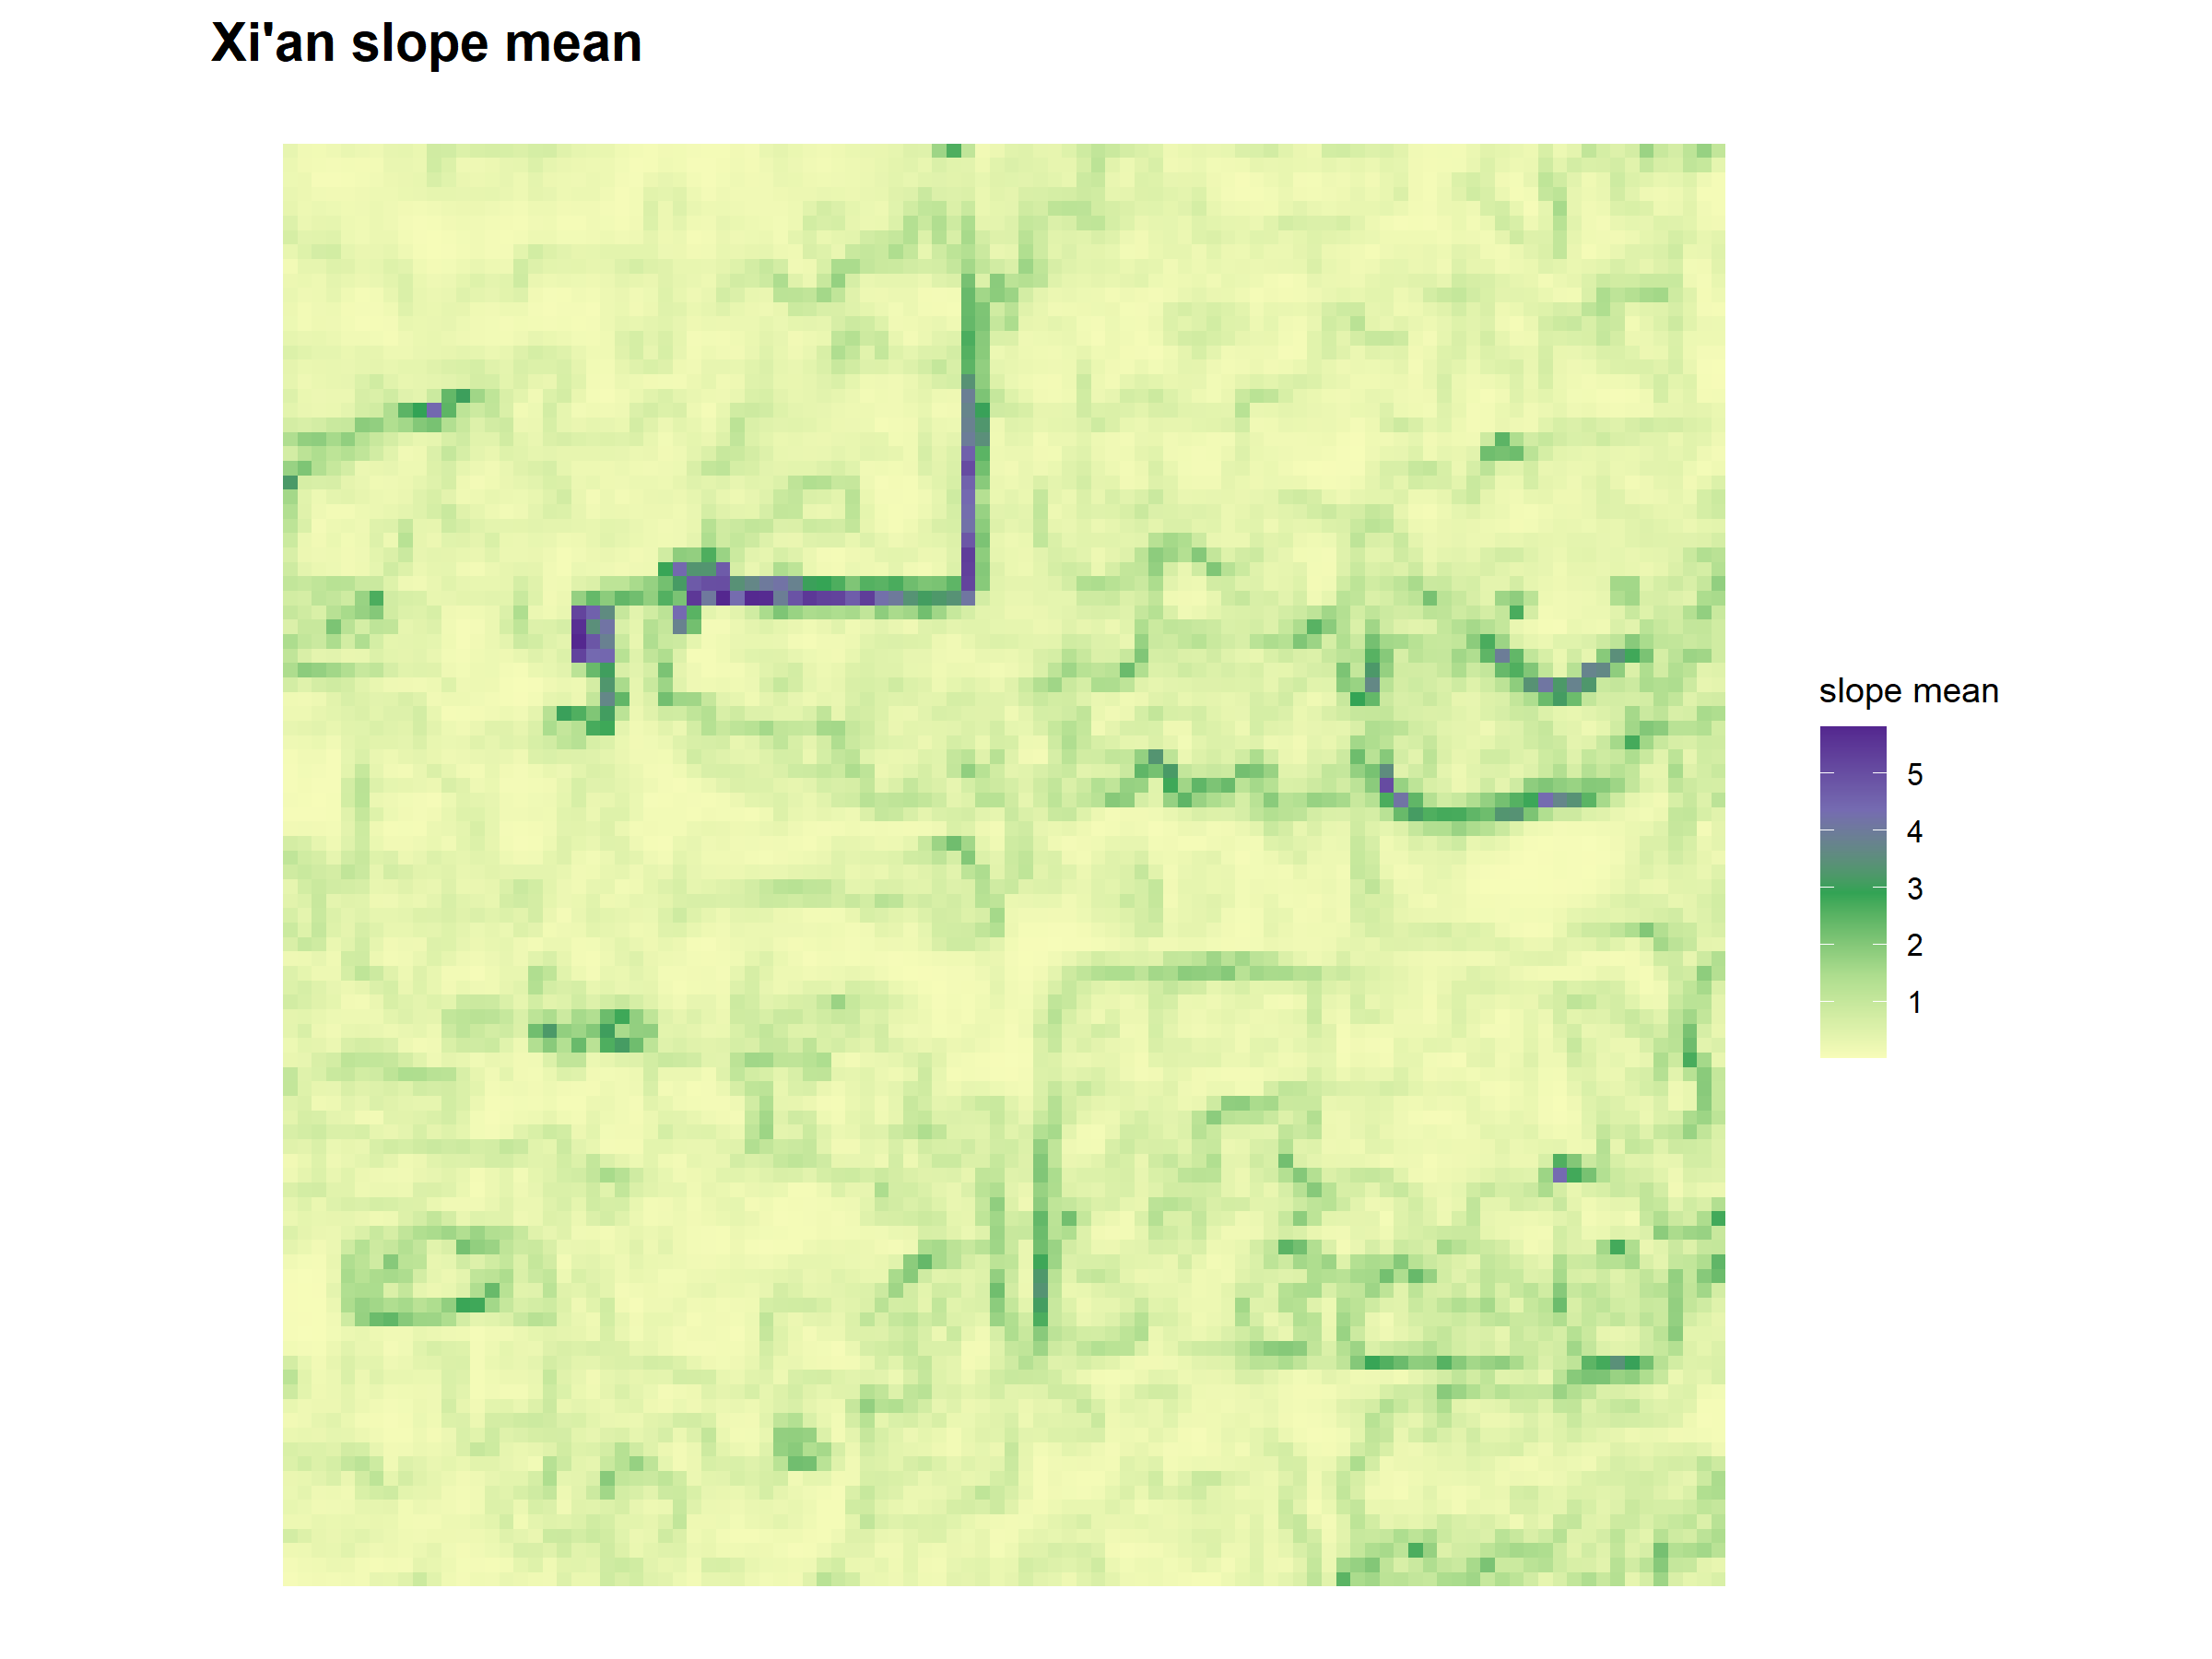
| DEM metrics | slope_mean |
Average slope per grid cell. |
4.2 Metric redundancy check
Before selecting the final metrics, the candidate metrics were checked for redundancy. This was necessary because clustering is sensitive to the input variables. If two metrics describe almost the same pattern, including both of them would give that pattern too much influence.
Pearson correlation was used to compare the candidate metrics. A correlation close to 1 or -1 means that two metrics are strongly related. In this analysis, metric pairs with an absolute correlation above about 0.80 were treated as highly redundant.
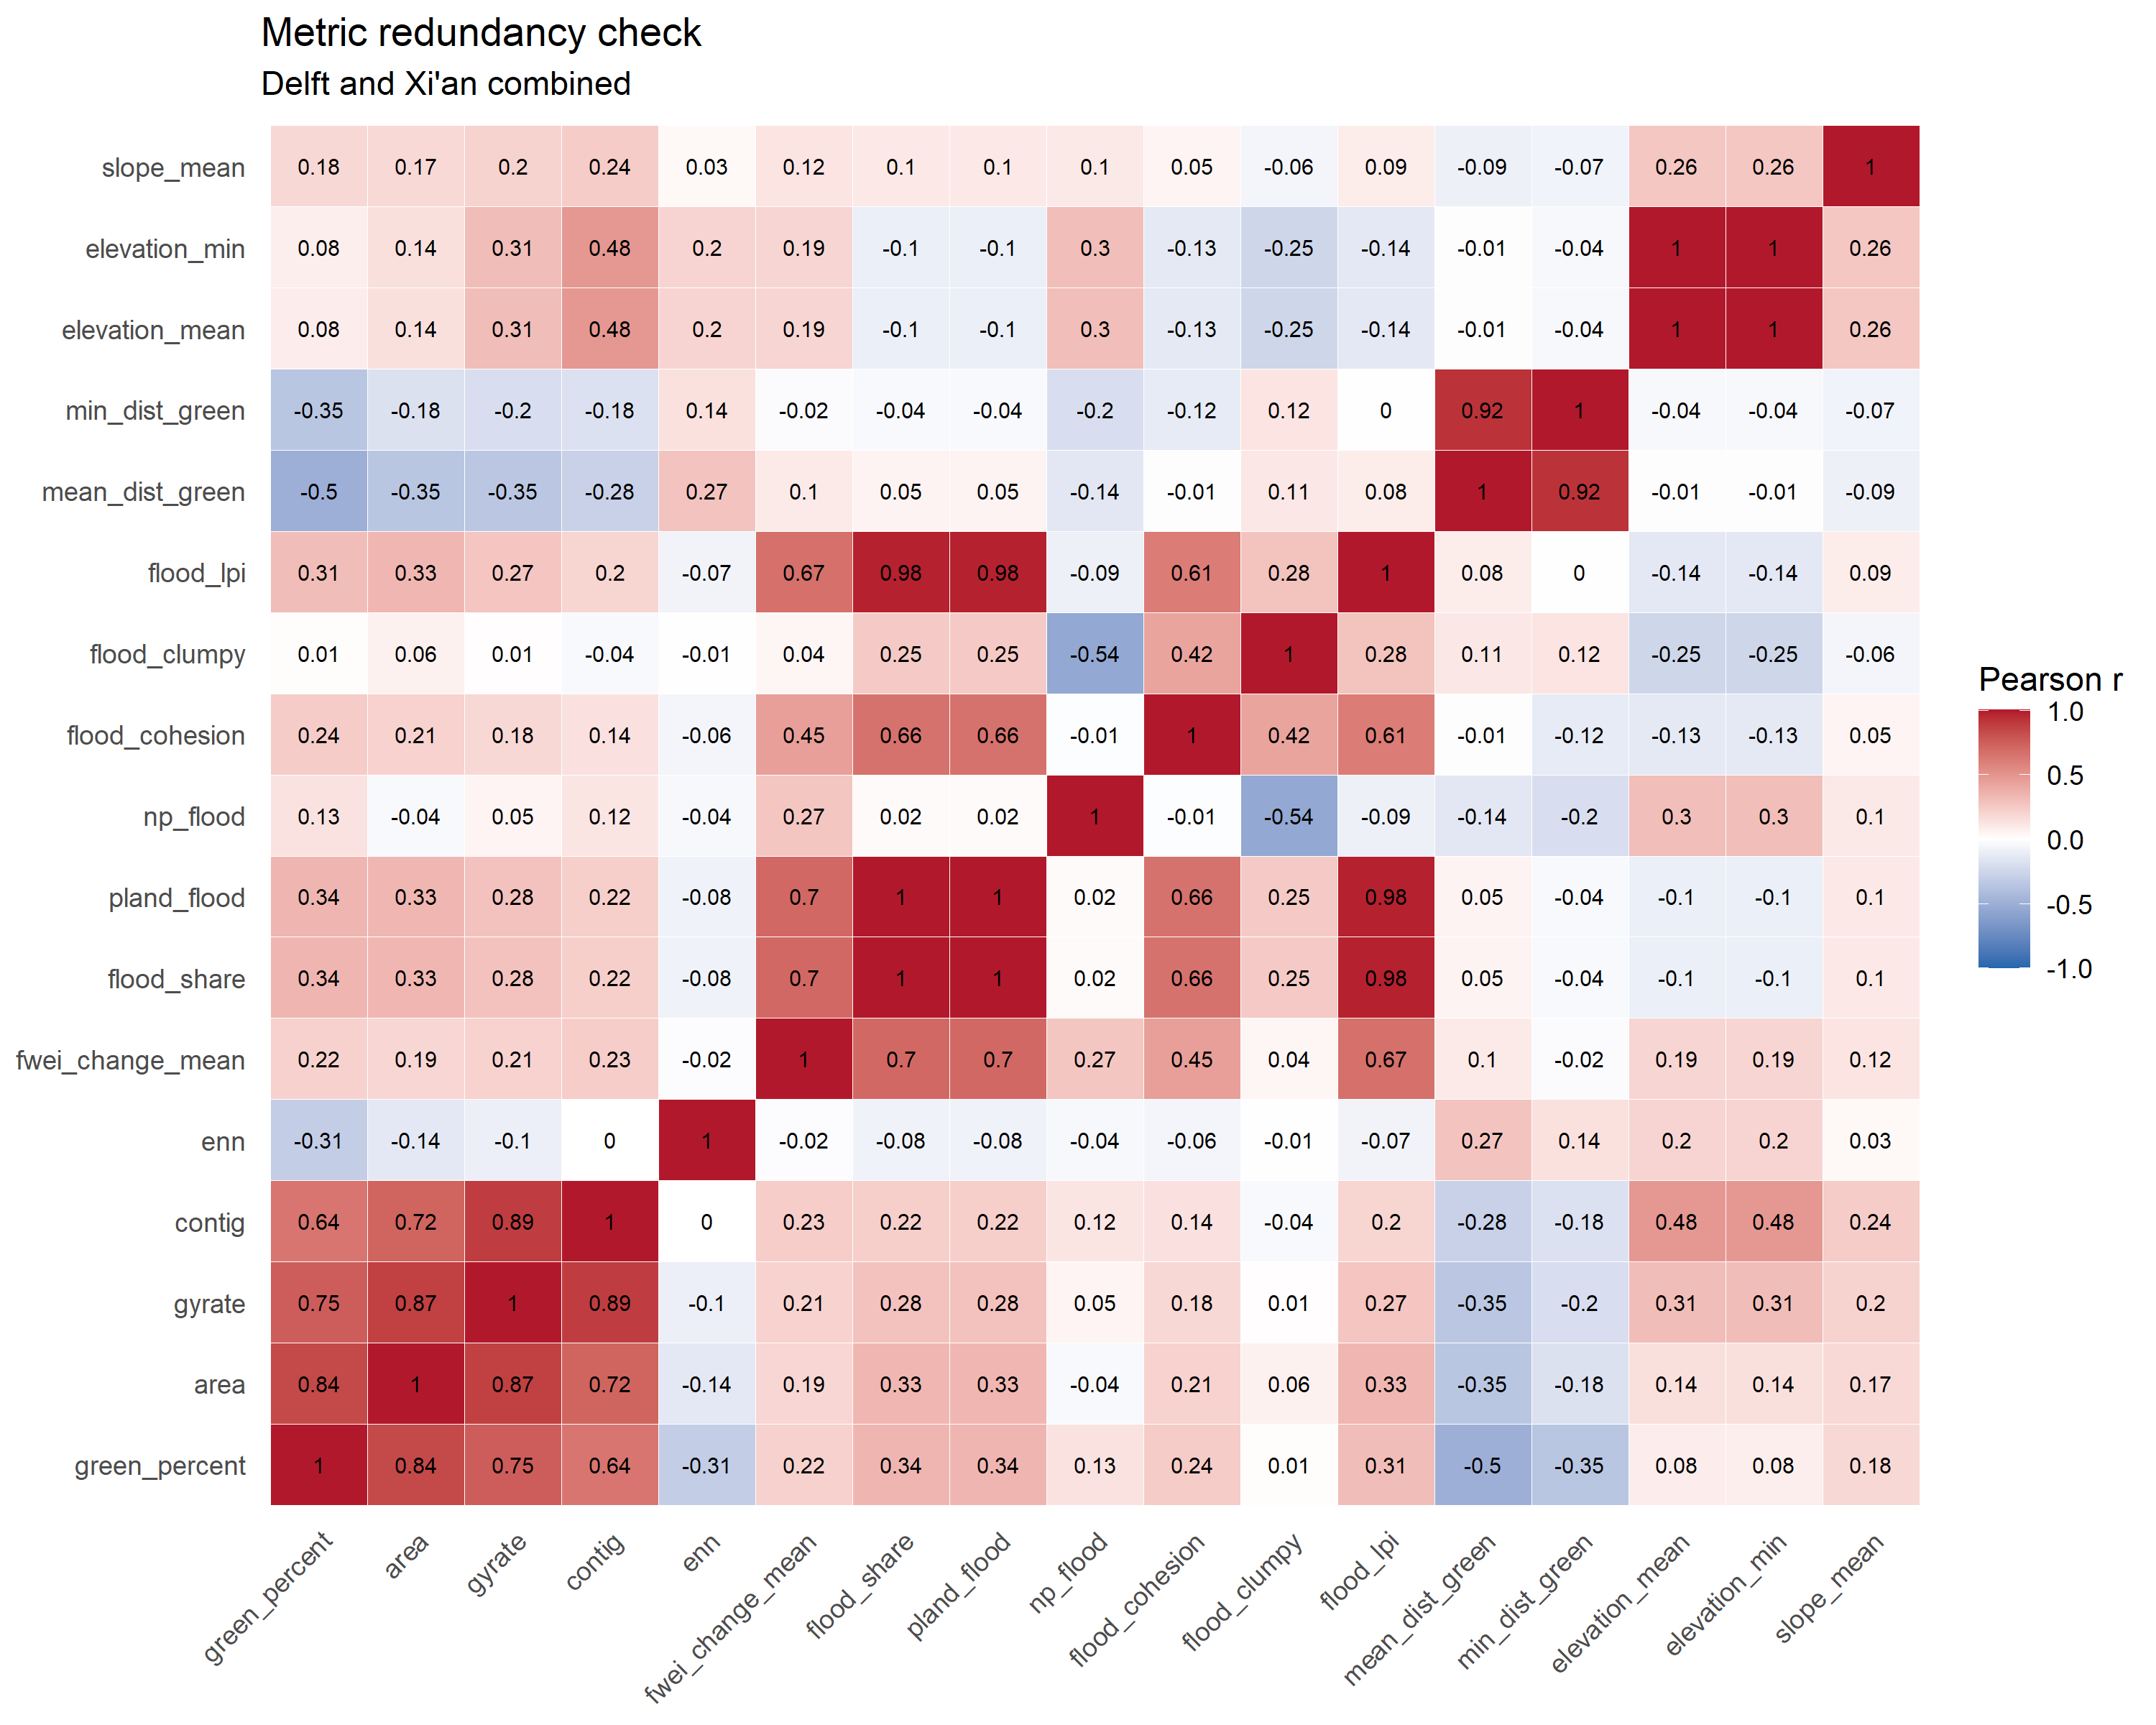
The redundancy check showed that several variables were strongly related. This was especially clear for flood extent metrics and elevation metrics. For example, flood_share and pland_flood had a correlation of 1.00, meaning they were identical in practice. elevation_mean and elevation_min were also almost identical.
4.3 Redundant metrics
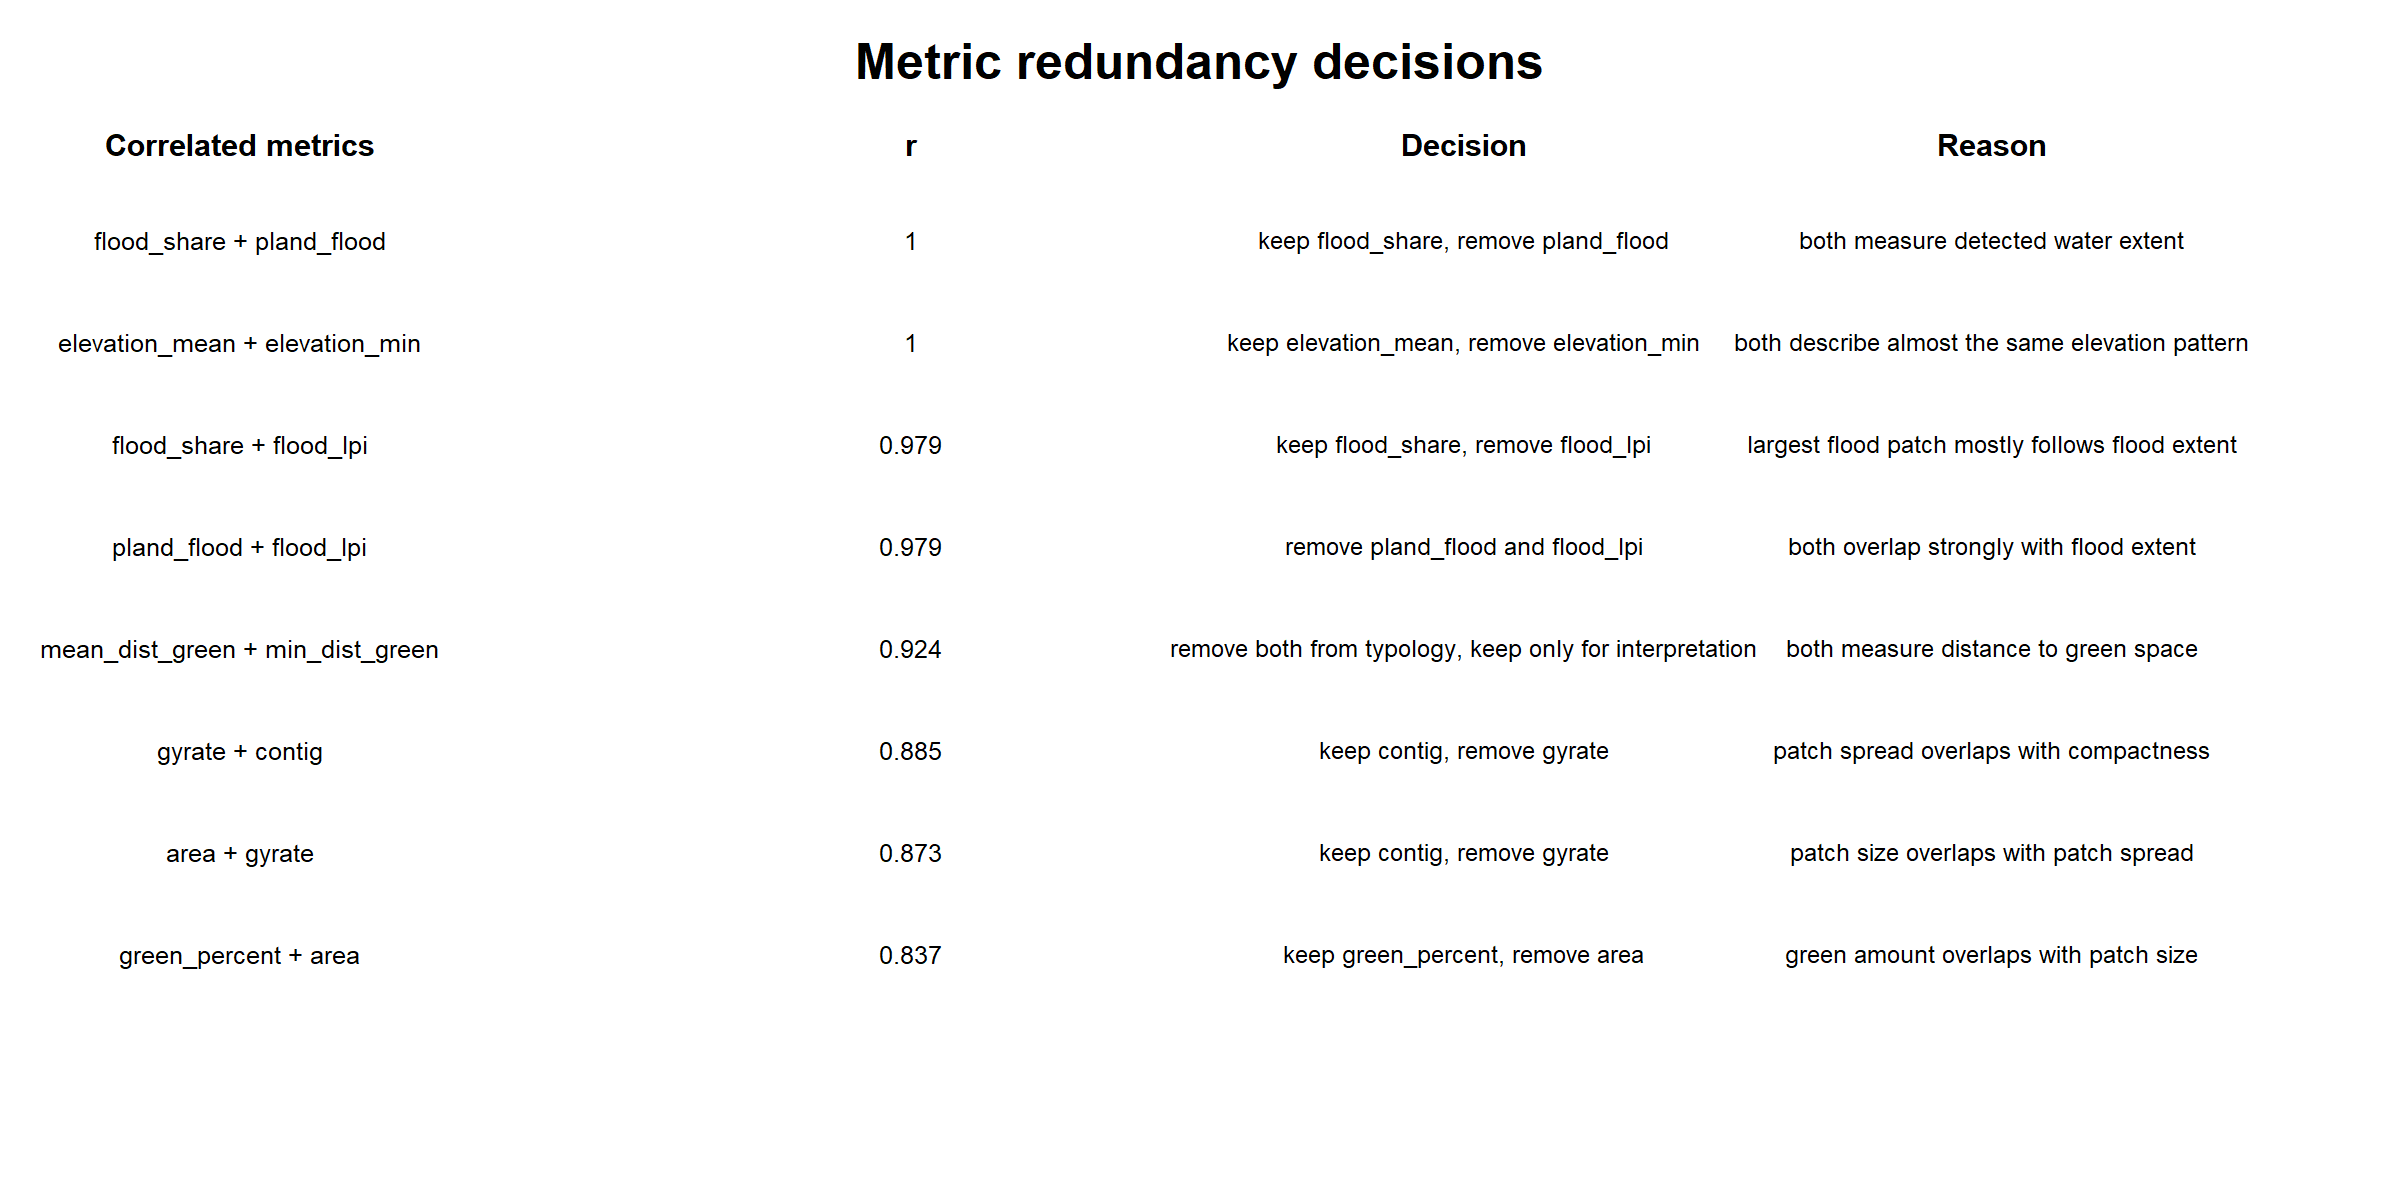
The table below shows the final decisions for the highly correlated metric pairs. In most cases, one metric was kept and the other was removed from the final metric set.
| correlated_metrics | correlation | decision | reason |
|---|---|---|---|
| flood_share + pland_flood | 1.000 | keep flood_share, remove pland_flood | both measure detected water extent |
| elevation_mean + elevation_min | 1.000 | keep elevation_mean, remove elevation_min | both describe almost the same elevation pattern |
| flood_share + flood_lpi | 0.979 | keep flood_share, remove flood_lpi | largest flood patch mostly follows flood extent |
| pland_flood + flood_lpi | 0.979 | remove pland_flood and flood_lpi | both overlap strongly with flood extent |
| mean_dist_green + min_dist_green | 0.924 | remove both from typology, keep only for interpretation | both measure distance to green space |
| gyrate + contig | 0.885 | keep contig, remove gyrate | patch spread overlaps with compactness |
| area + gyrate | 0.873 | keep contig, remove gyrate | patch size overlaps with patch spread |
| green_percent + area | 0.837 | keep green_percent, remove area | green amount overlaps with patch size |
The main decisions were as follows. flood_share was kept instead of pland_flood, because both metrics measure detected surface water extent. flood_lpi was removed because it was also strongly related to flood extent. elevation_mean was kept instead of elevation_min, because both showed almost the same elevation pattern. gyrate was removed because it strongly overlapped with other green patch metrics. area was also removed from the final metric set because it strongly correlated with green_percent.
The distance to green metrics, mean_dist_green and min_dist_green, were not used in the final metric set. They are still useful for interpretation, but they describe the relationship between detected water and green space rather than the main green, flood, or topographic condition of the grid cell.
4.4 Final selected metrics
After the redundancy check, the final metric set was reduced. The aim was to keep one representative metric for each important dimension of the analysis: green amount, green compactness, green isolation, FWEI derived water change, flood extent, flood fragmentation, flood clustering, elevation, and slope.
| Metric group | Final metric | Why it was kept |
|---|---|---|
| Green amount | green_percent |
Represents how much green space is present in each grid cell. |
| Green configuration | contig |
Represents the compactness and internal connectedness of green patches. |
| Green isolation | enn |
Represents how isolated green patches are from nearby green patches. |
| Surface-water change | fwei_change_mean |
Represents the average FWEI-derived surface-water change. |
| Flood extent | flood_share |
Represents the share of each cell with detected surface-water increase. |
| Flood fragmentation | np_flood |
Represents the number of separate detected flood patches. |
| Flood clustering | flood_clumpy |
Represents whether detected water is clustered or scattered. |
| Topography | elevation_mean |
Represents average elevation conditions. |
| Topography | slope_mean |
Represents average terrain steepness or flatness. |
These selected metrics were then used as the basis for the combined typology analysis. The metric set keeps the main dimensions of the research question while avoiding double counting strongly overlapping variables.
4.5 Final metric maps
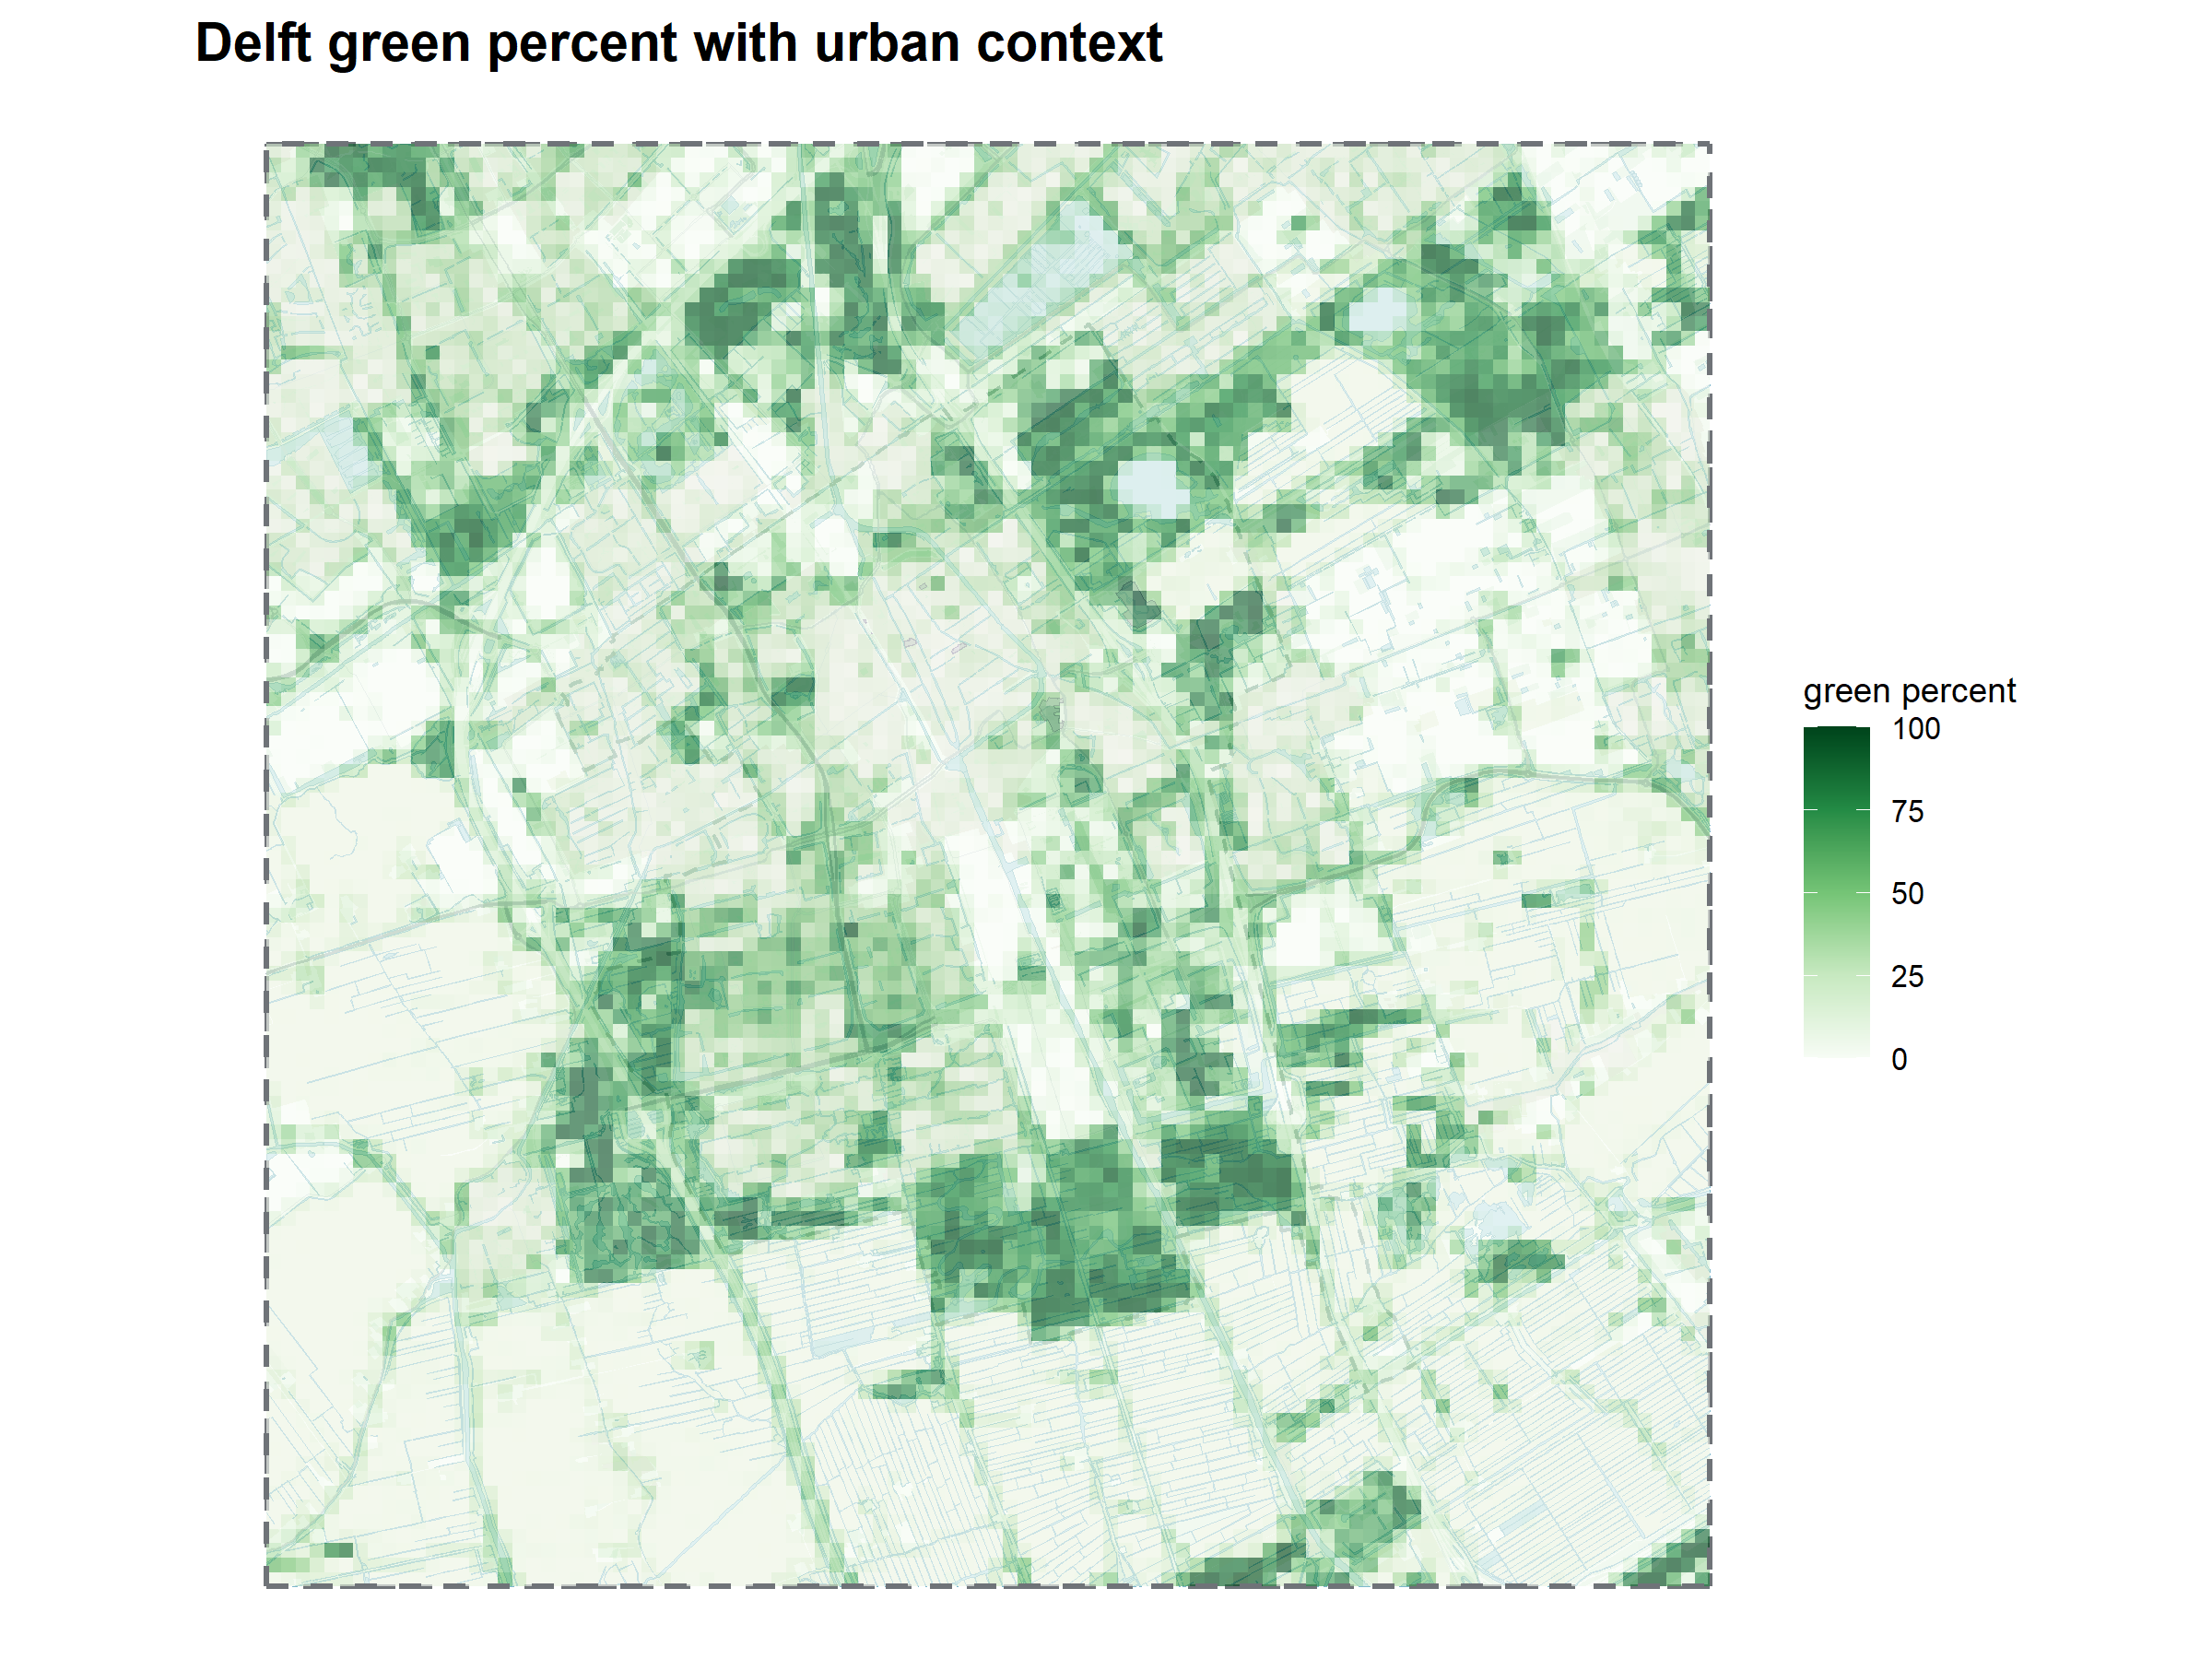
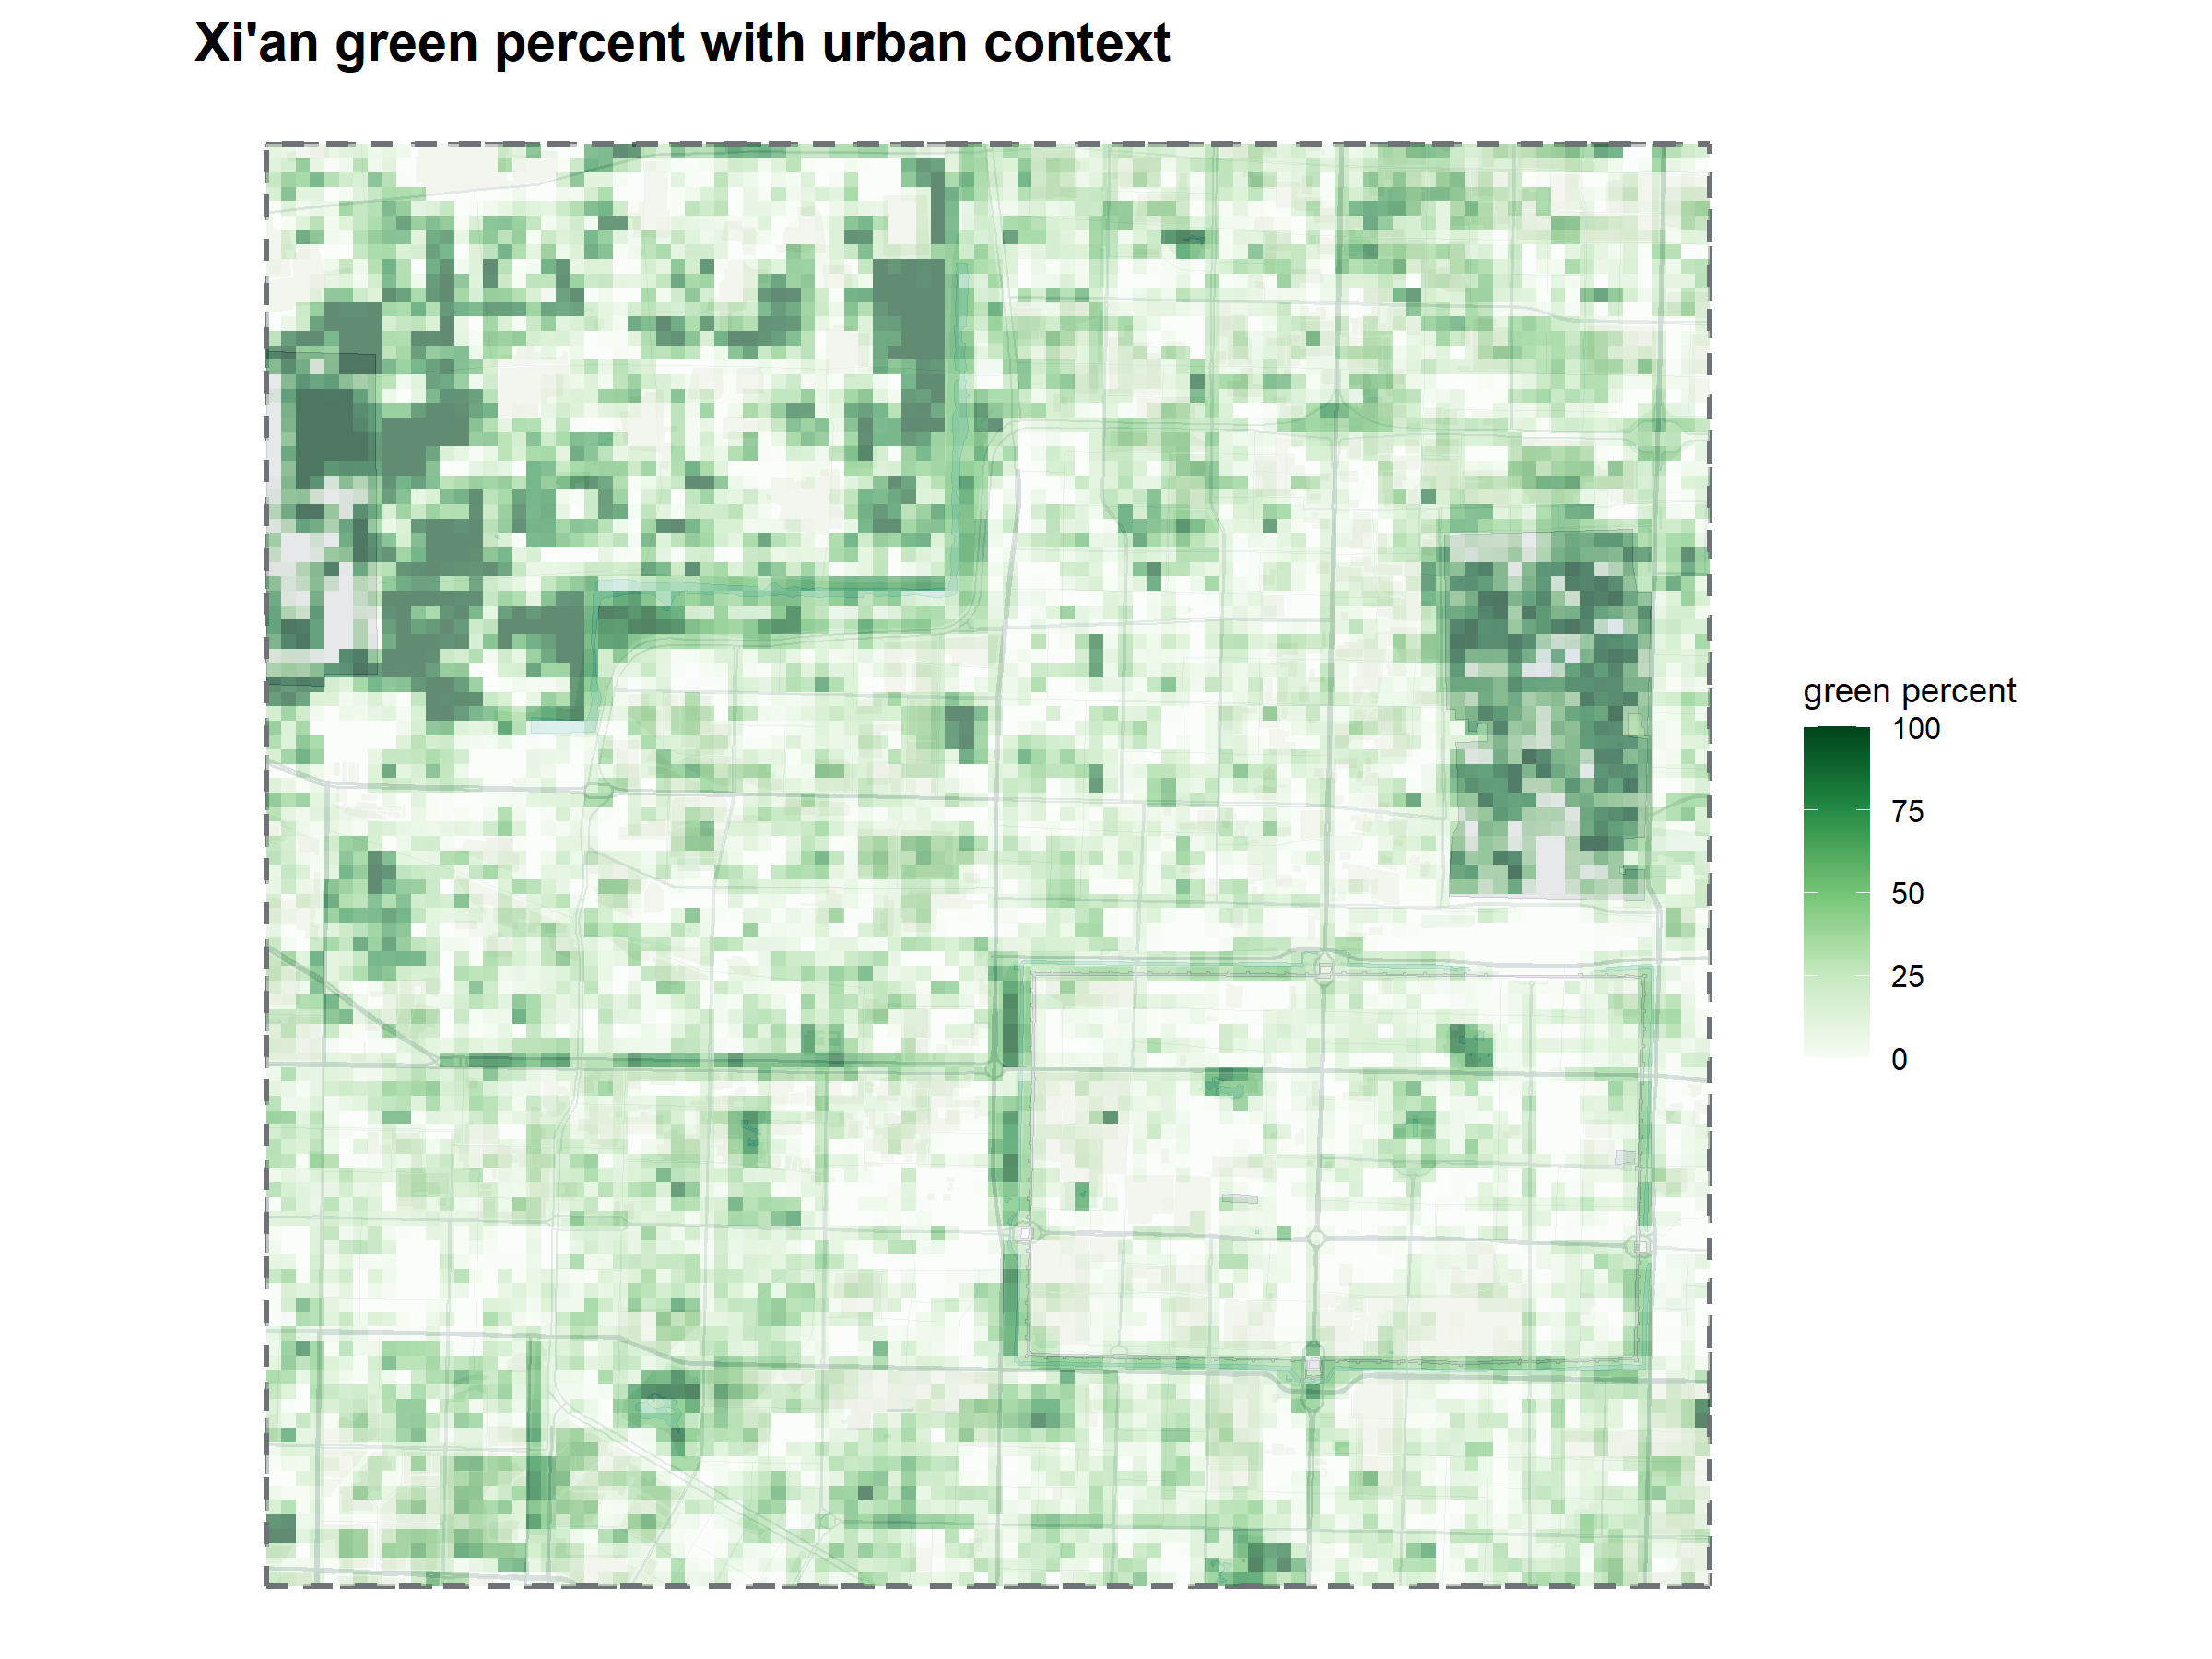
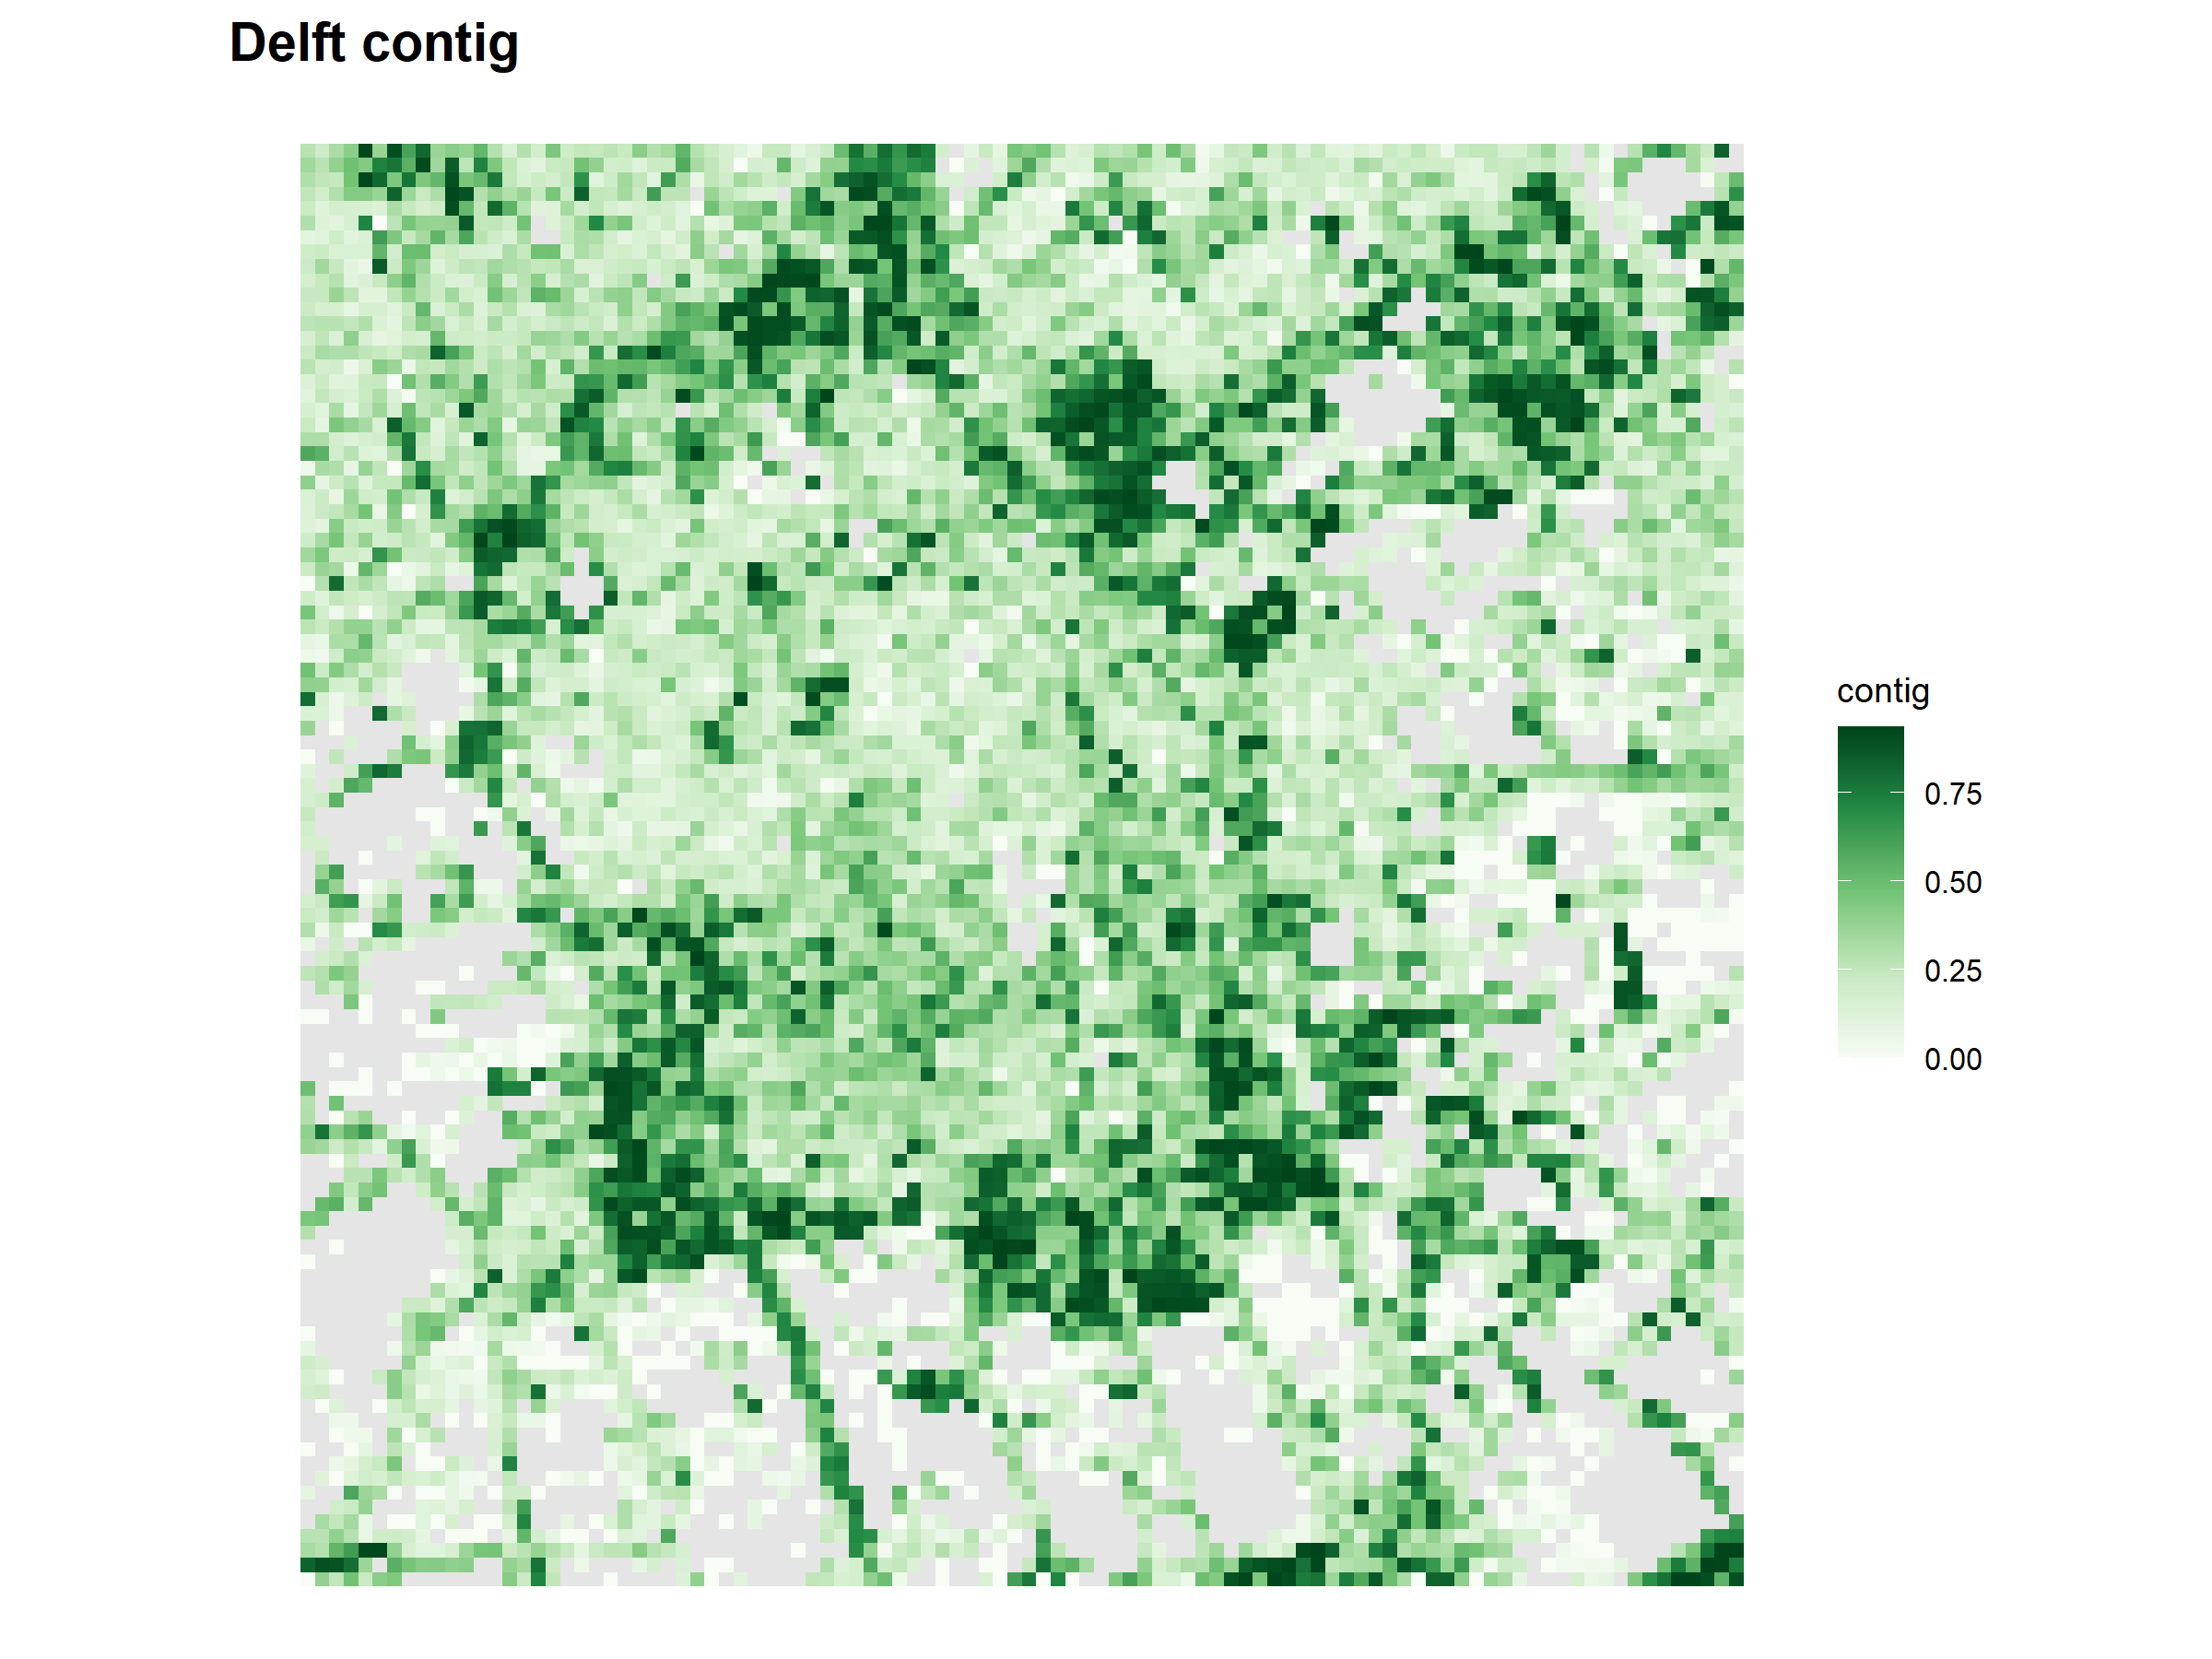
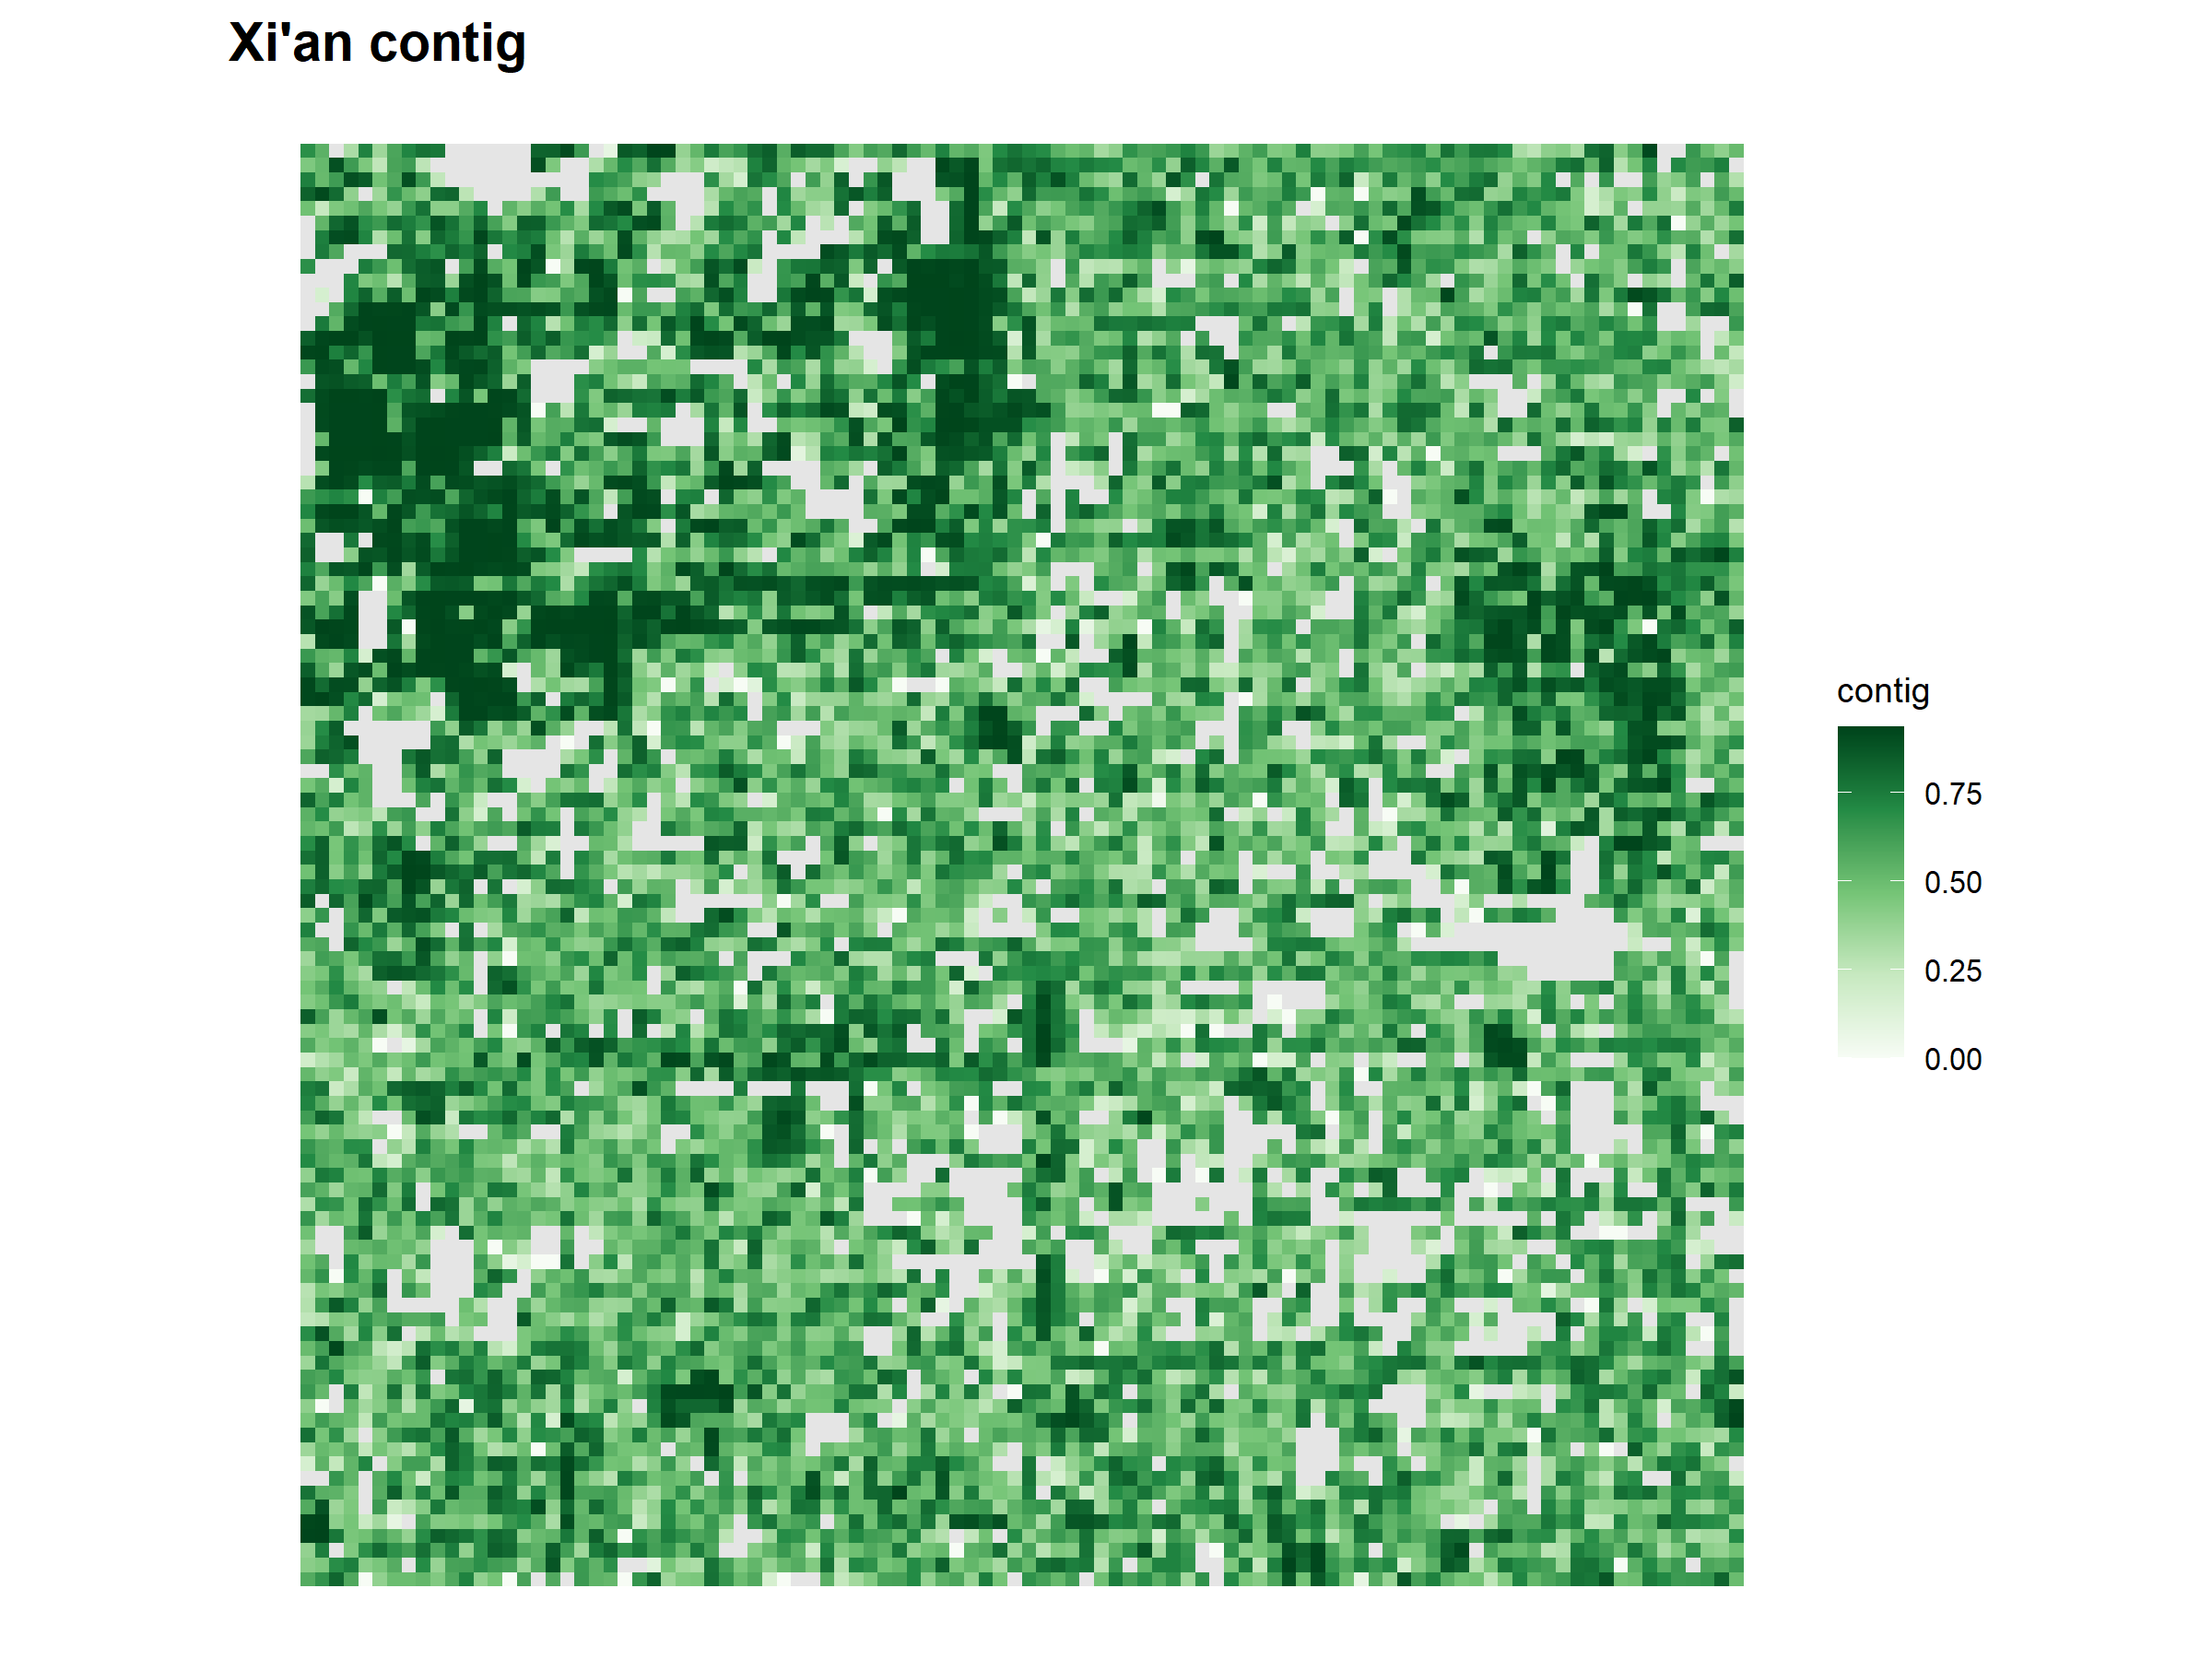
The maps below show the final metrics that were kept after the redundancy check. They are shown in tabs so that the spatial patterns can be compared without making the chapter too long.
green_percent shows the amount of green space in each grid cell.
contig shows whether green patches are compact and internally connected.
enn shows how isolated green patches are from other green patches.
fwei_change_mean shows the average FWEI-derived surface-water change per grid cell.
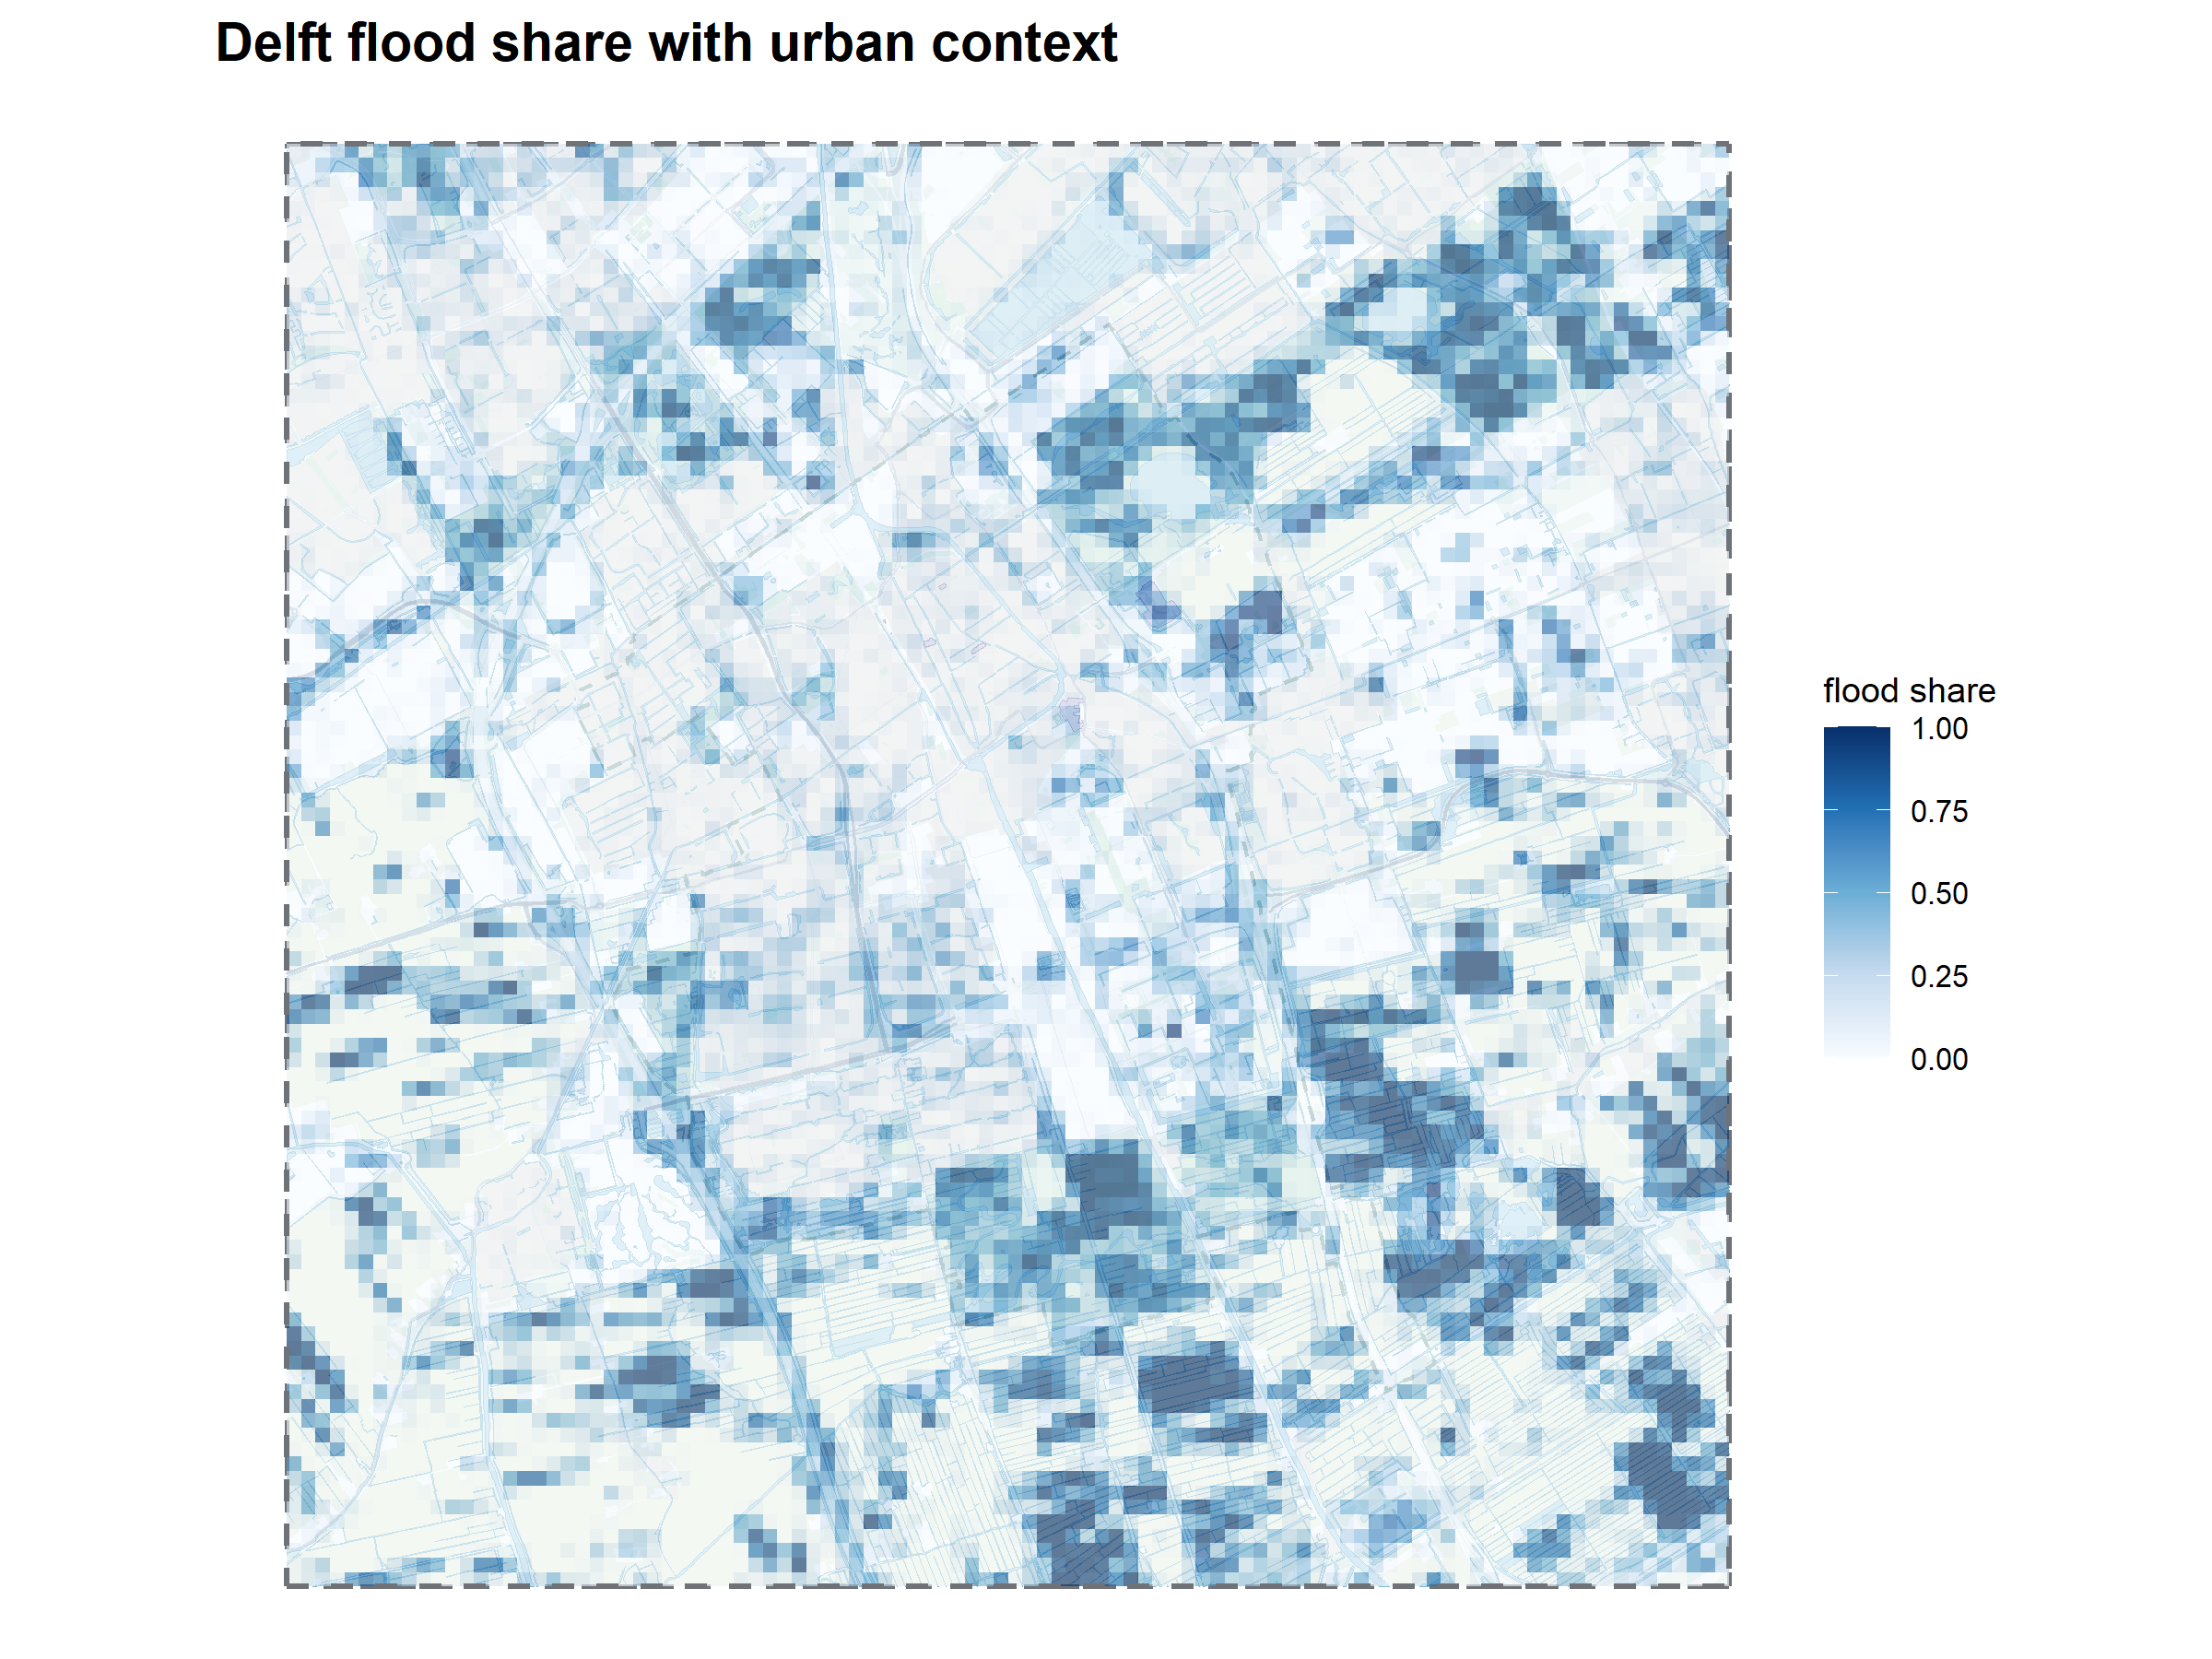
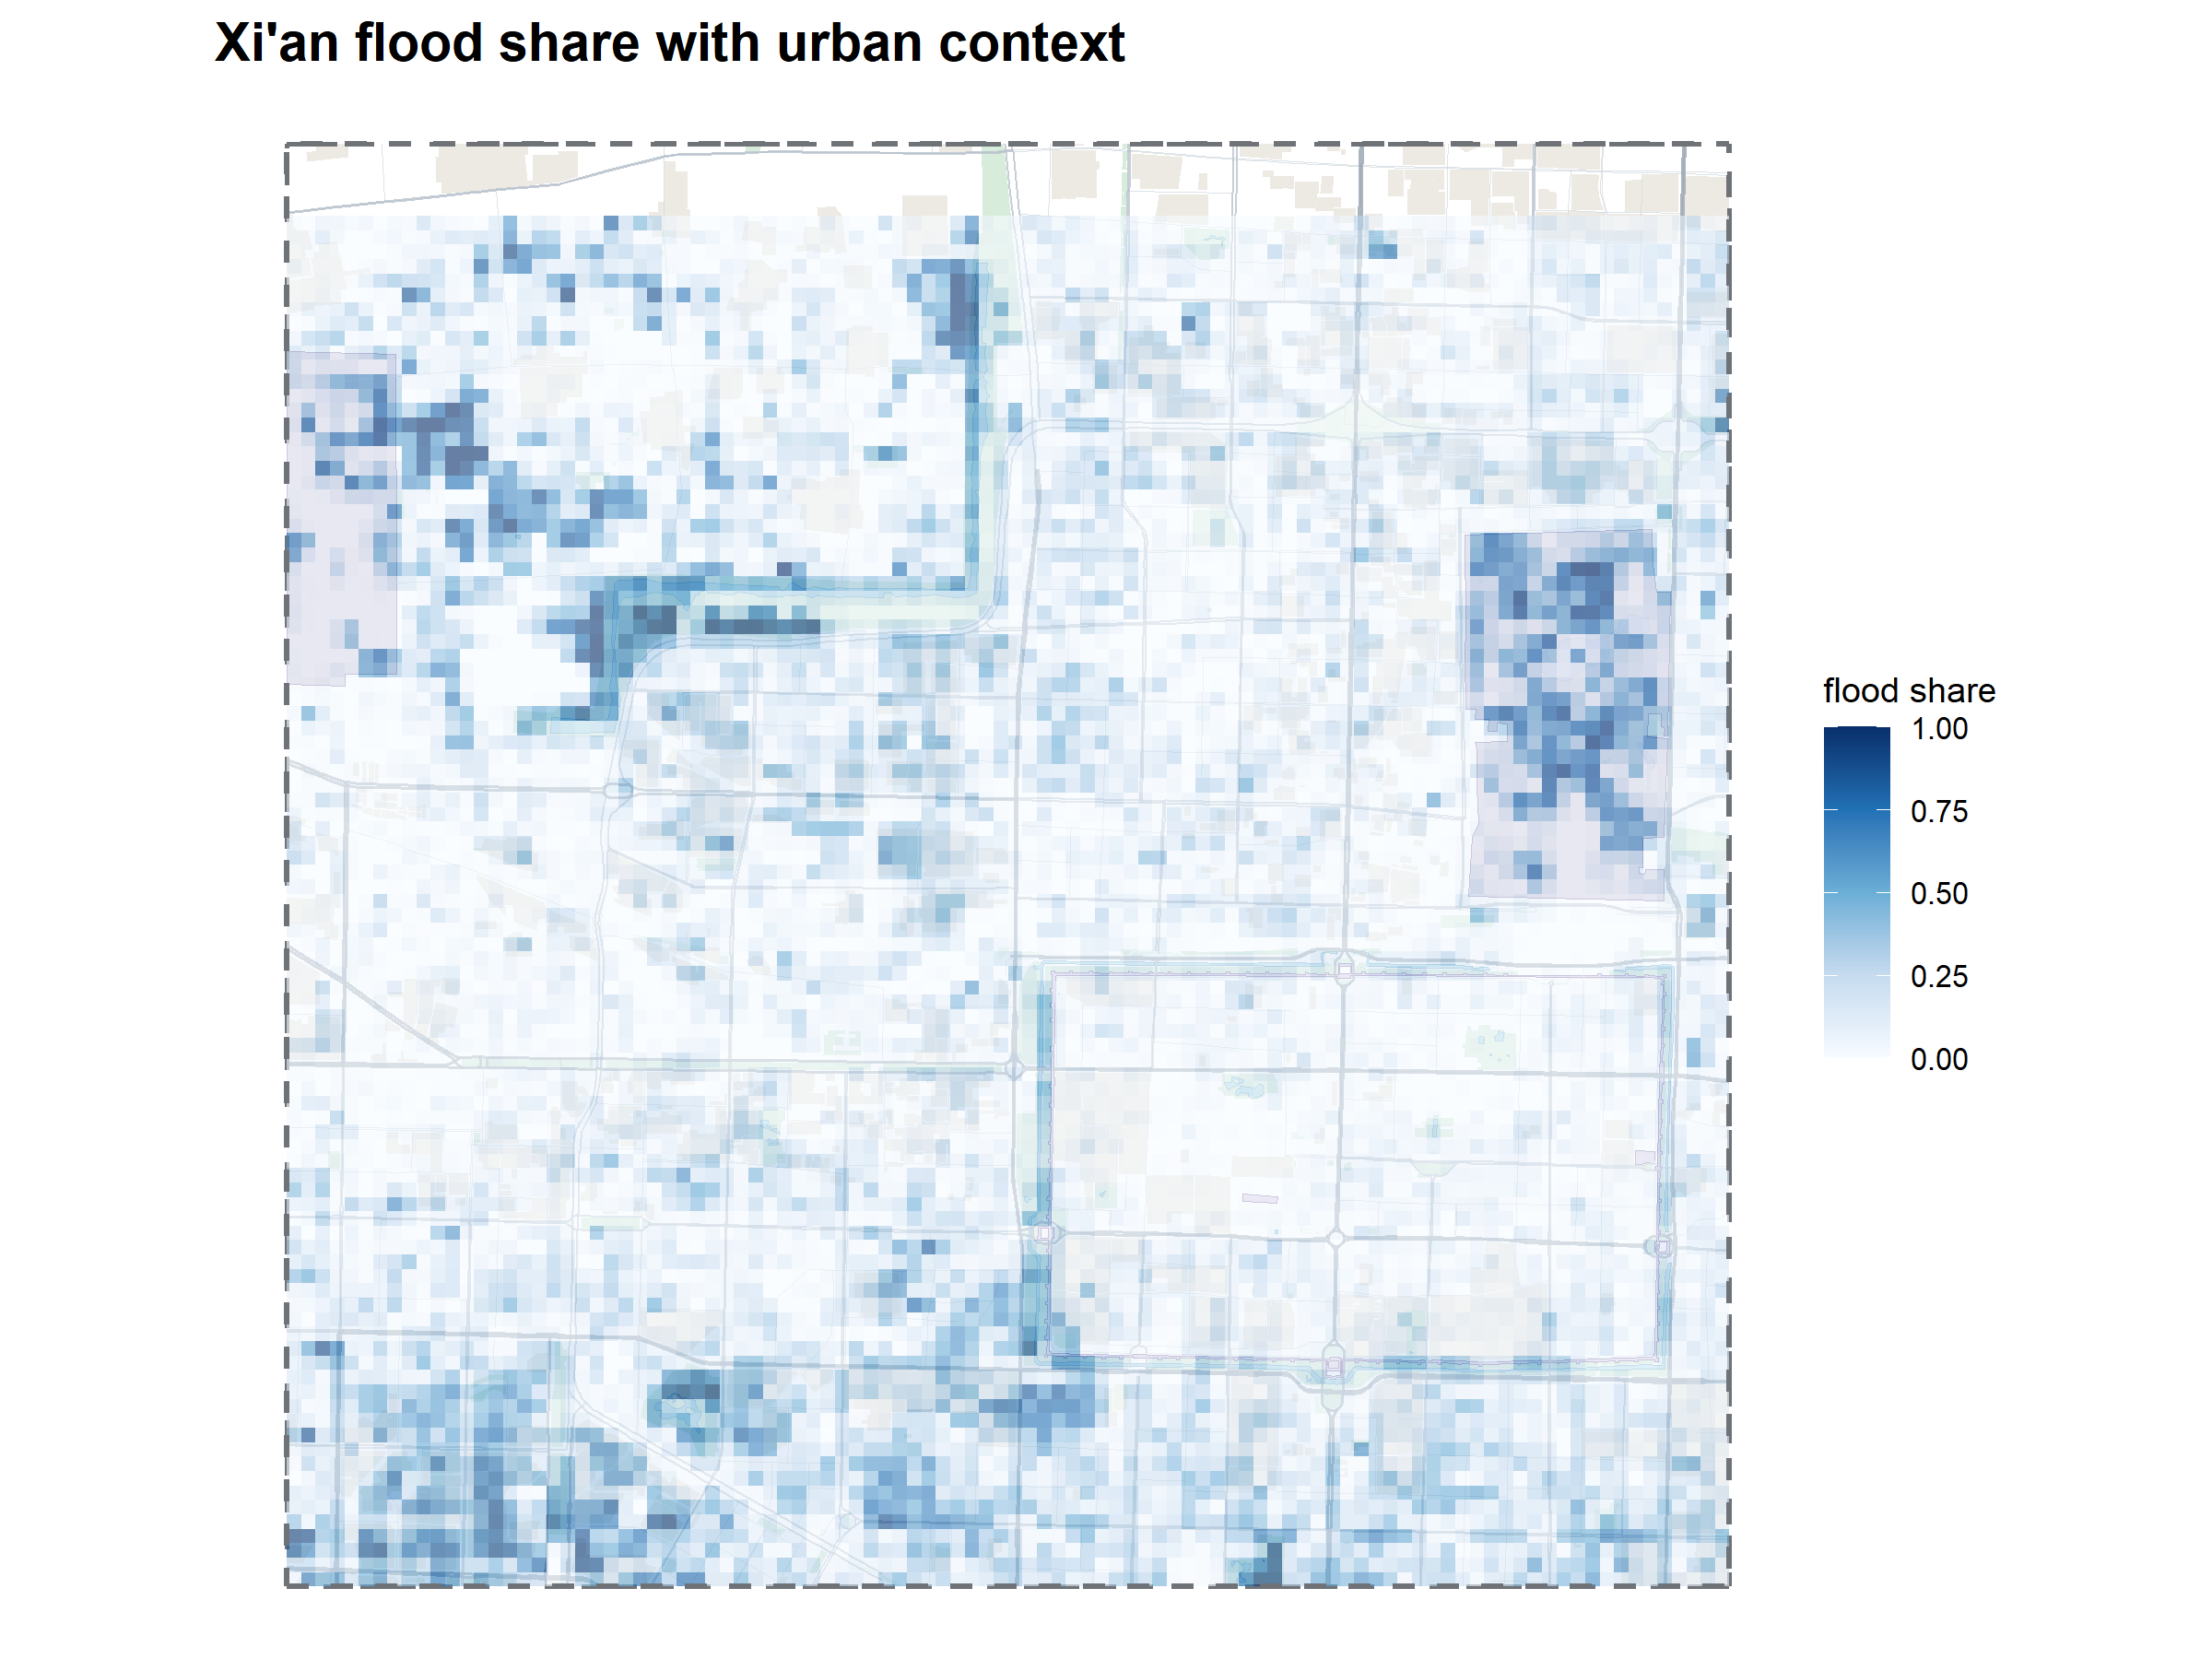
flood_share shows the proportion of each grid cell where surface-water increase was detected.
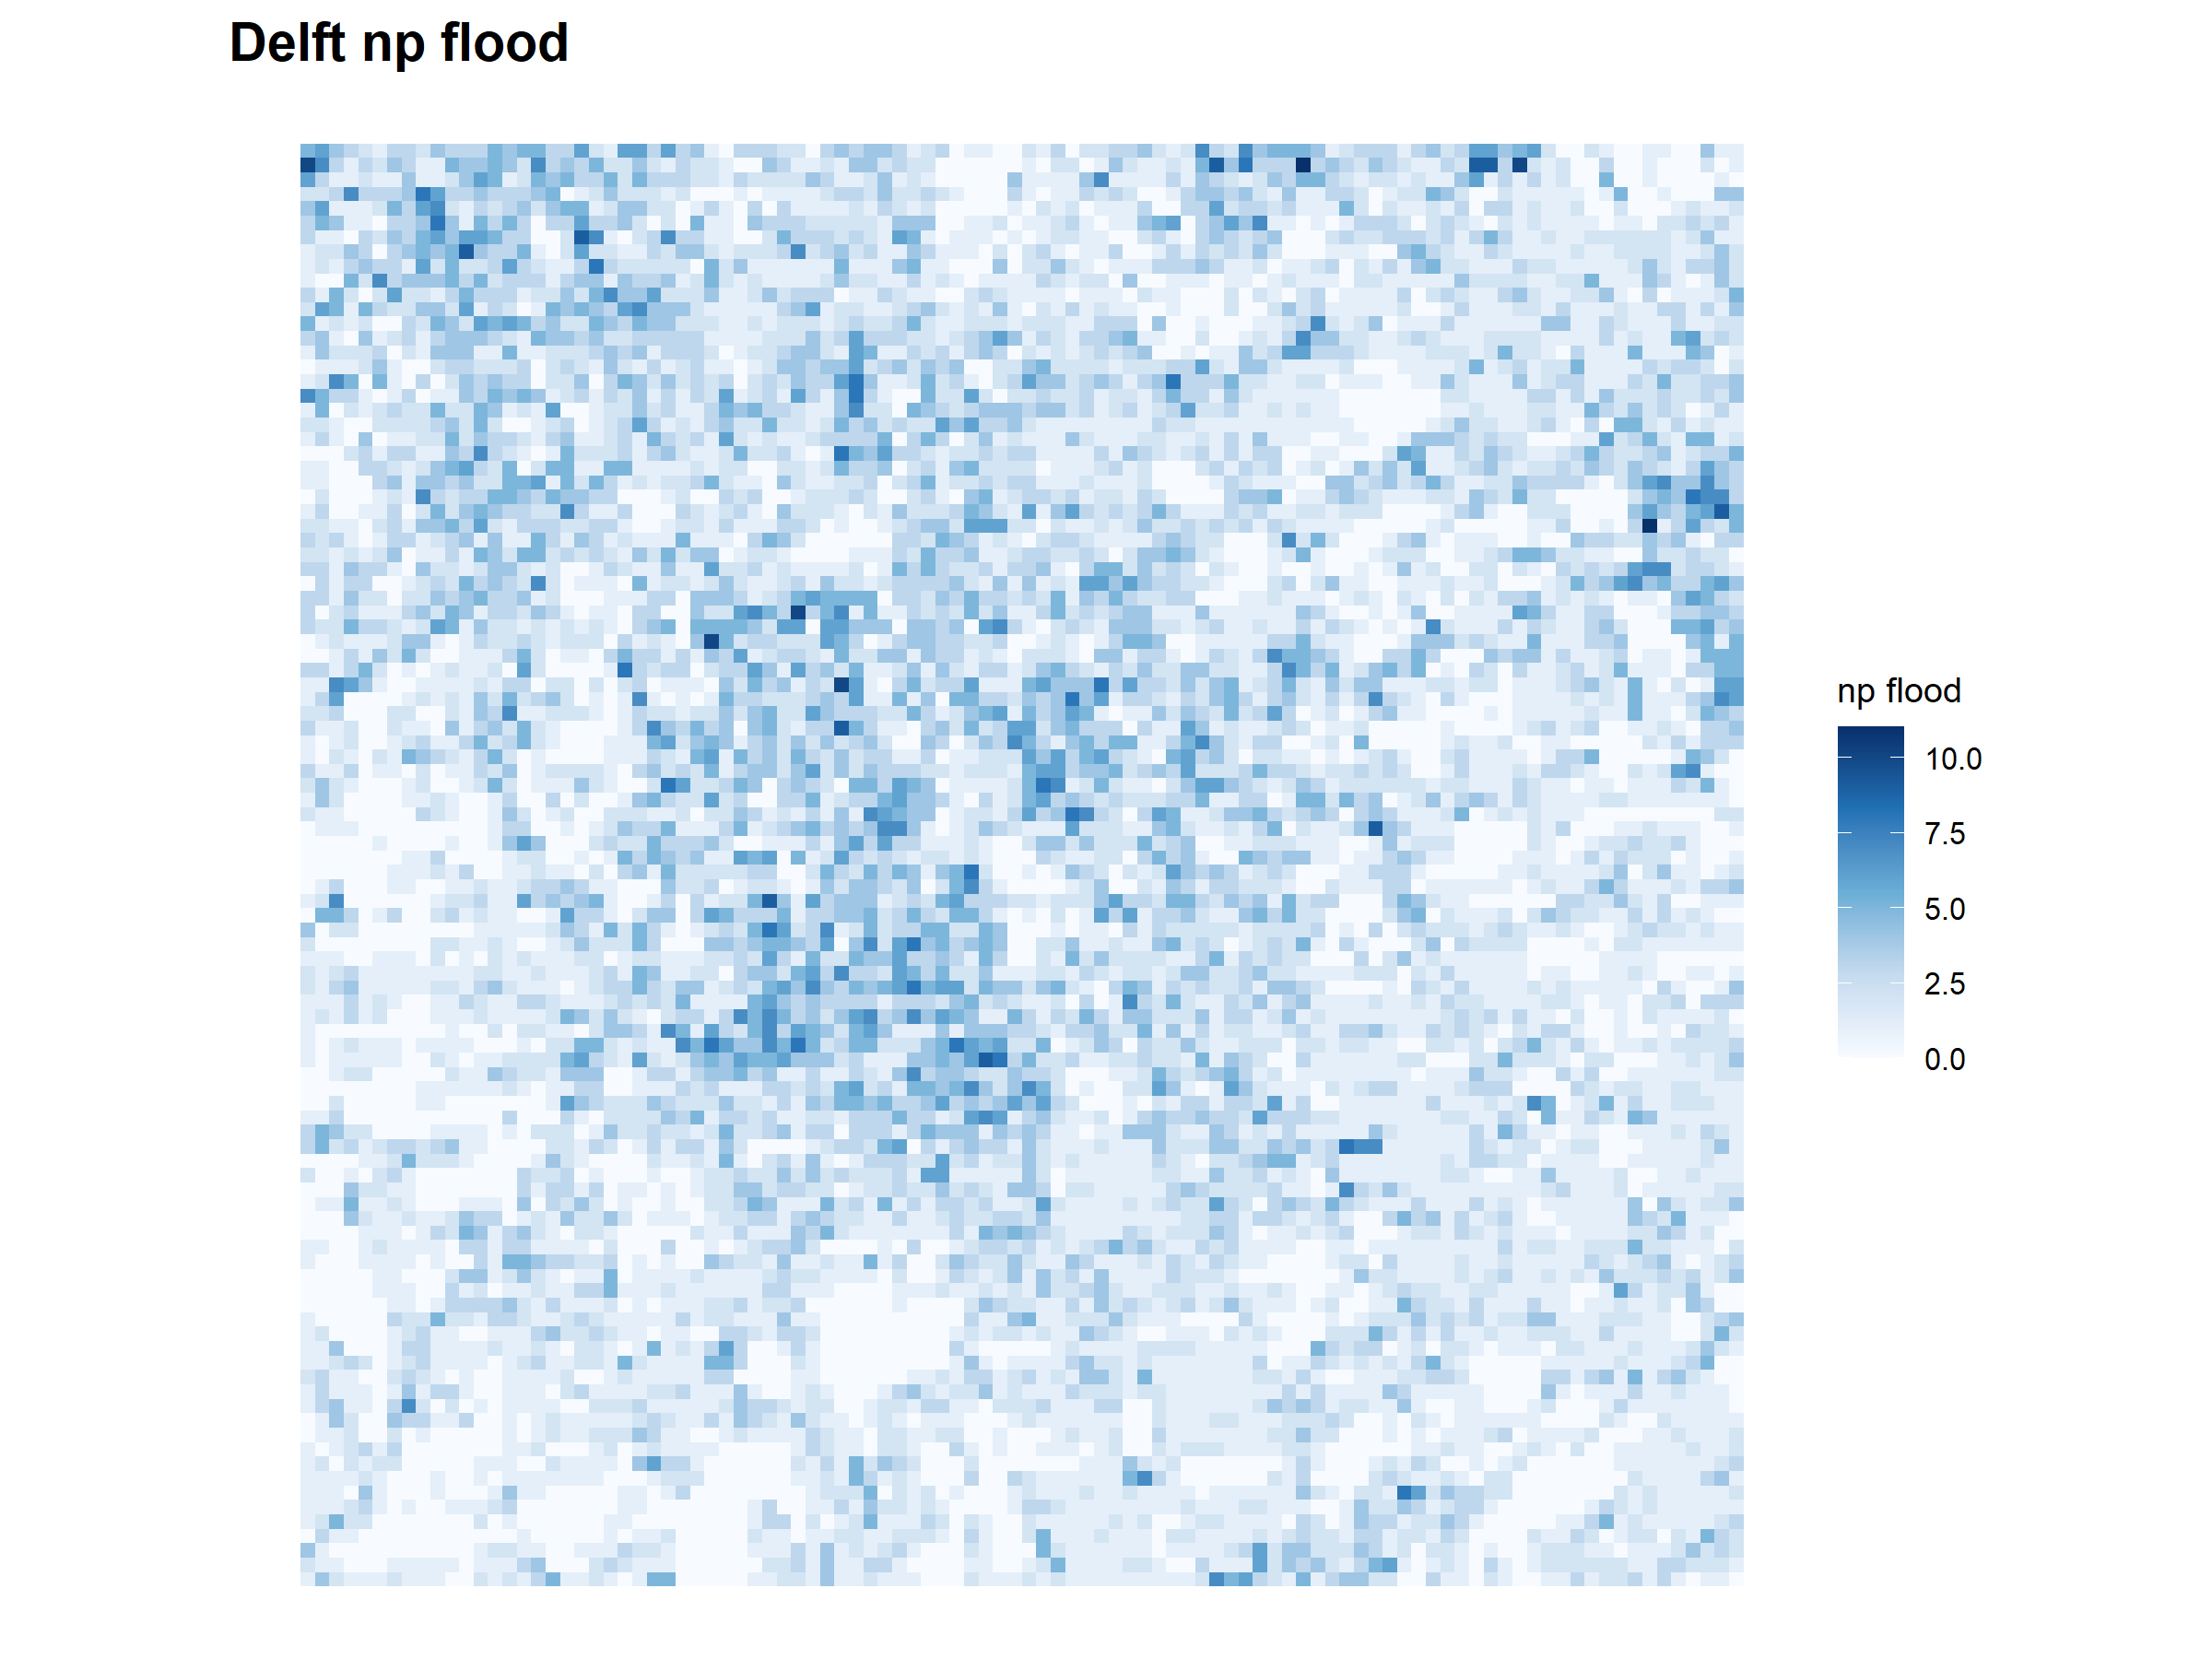
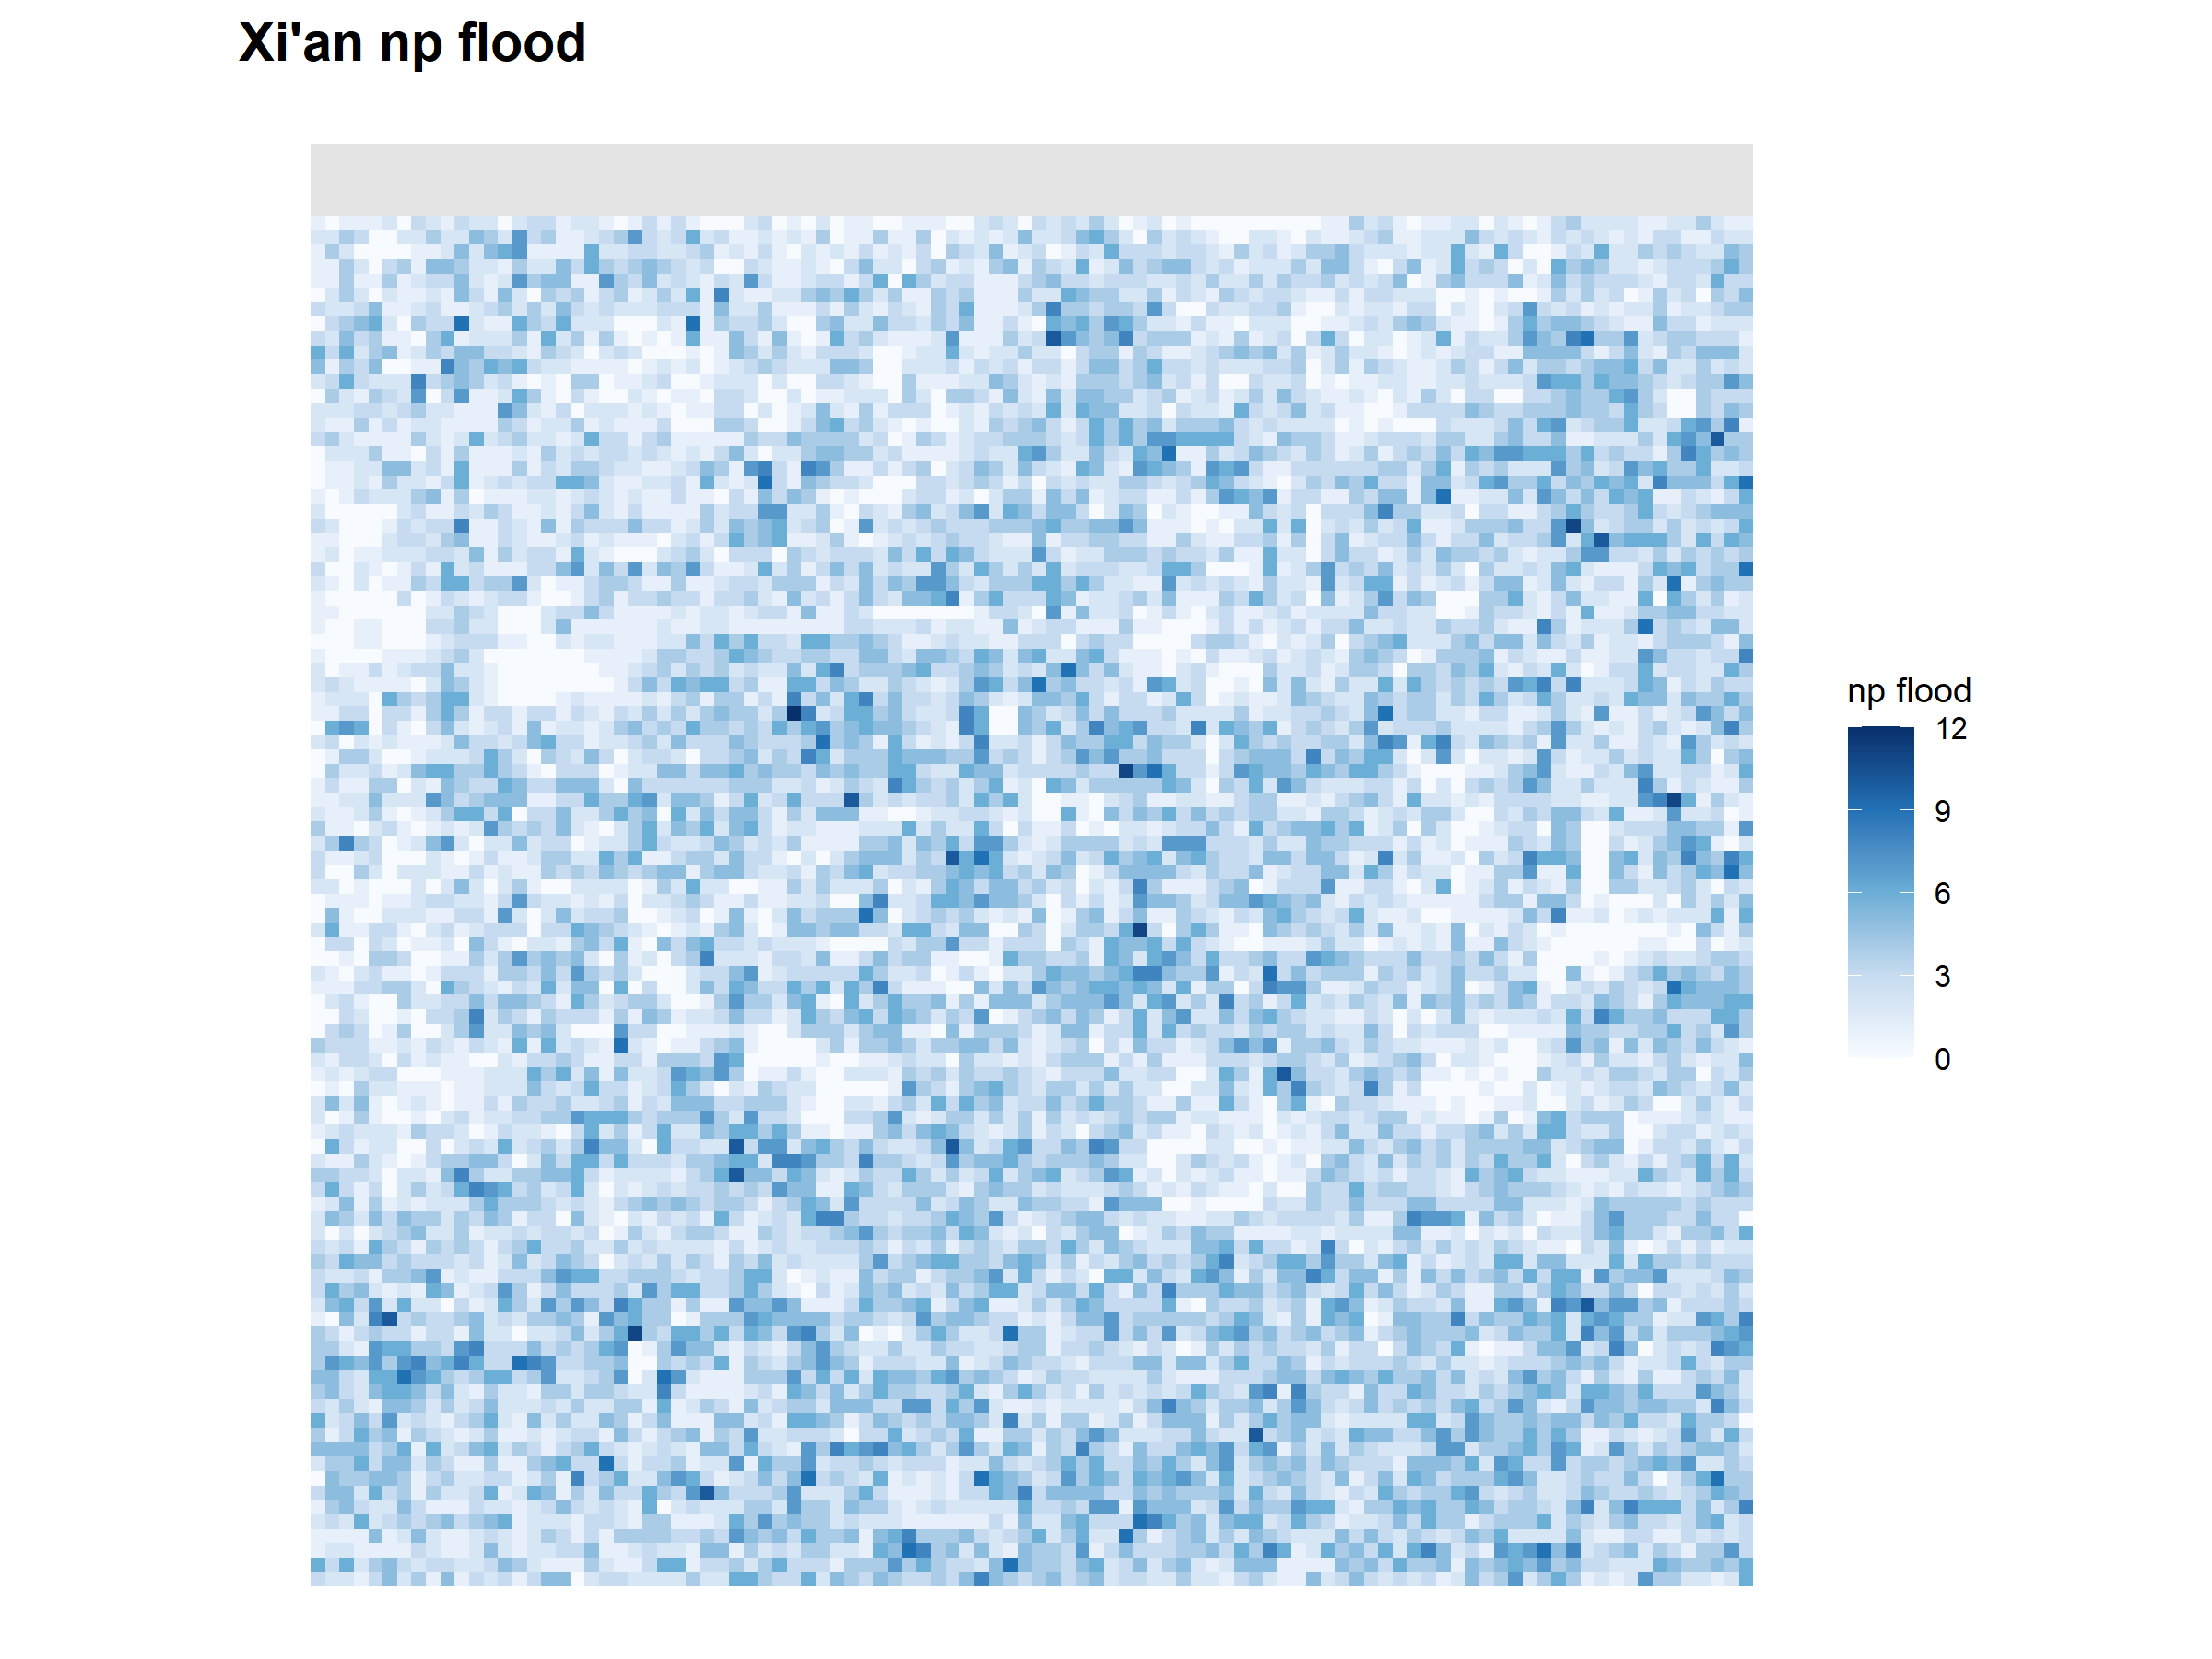
np_flood shows whether detected water appears as one patch or many separate patches.
flood_clumpy shows whether detected water pixels are clustered or scattered.
elevation_mean shows the average elevation per grid cell.
slope_mean shows the average slope per grid cell.